Pure Coincidence? October 29, 2018

Are you lucky? I was, a few weeks ago. On 8th October 2018, I posted an article titled “Good Business = Good Investment? Think Again!” And warned that despite new highs, the stock market was facing extremely frothy valuations.
A recent headline in Bloomberg read:

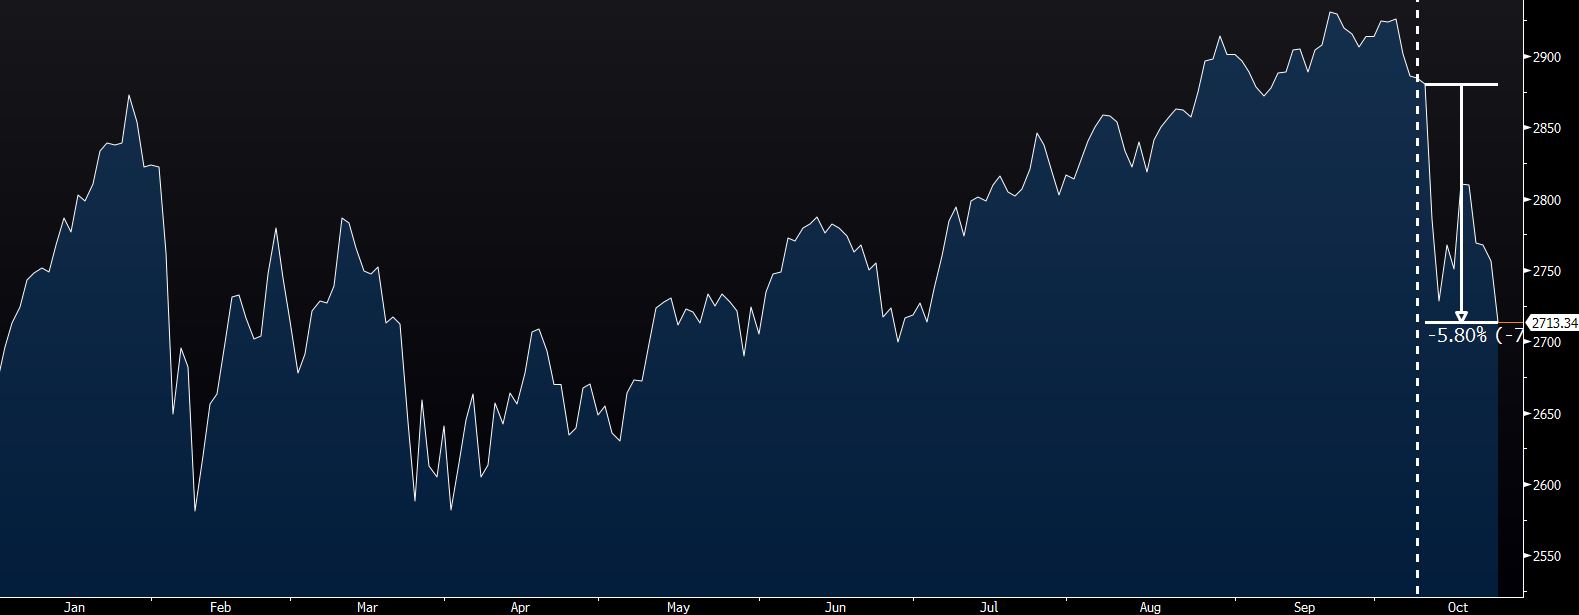
Looking back, 8th October was almost the inflection point and the S&P 500 has declined about 5.8% since then. Other topics hogging the news include the US Federal Reserve’s interest rate hike agenda, escalating Sino-US tensions, US earnings releases and eyes watching the Middle East.
 Chart 1: S&P 500 as of mid-market, 24th October 2018 (Dotted White Line: 8th October 2018, date of previous article posting)
Skill or Luck?
As much as I would like to give myself some credit and say, “I told you so”; this was purely coincidental. Am I able to repeat such a feat again? Probably not. There is little chance anyone of us could have predicted this series of events, especially with precision AND consistency. It wasn’t skill. I was lucky.
So what is the difference between the two?
Luck is when you strike a life-changing lottery.
Skill is when you strike that life-changing lottery, every weekend.
When it comes to your managing your investments, we want to separate luck from skill.
To know how good a manager is, we turn to Richard Grinold’s “Fundamental Law of Active Management”, measured via two variables – Information Coefficient (IC) and Breadth (N):
| Variable | Measure |
| Information Coefficient (IC) | (2 * % Correct) – 1 |
| Breadth (N) | Number of Independent Decisions |
Information Coefficient (IC) measures the skill level of the manager and ranges from positive 1 (perfectly correct) to negative 1 (totally wrong). An Information Coefficient (IC) of 0 suggests that decisions made are no better than random guesses.
Say there were five overturned cups with three of them hiding a coin underneath and I have three tries to guess which cups are hiding the coin.
| If I correctly get… | My IC is… | My skill is… |
| All 3 coins | (2 * 100%) – 1 = 1 | Perfect! |
| 2 out of 3 coins | (2 * 66%) – 1 = 0.33 | Quite Ok |
| 1 out of 3 coins | (2 * 33%) – 1 = -0.34 | Try harder |
| None of the three coins | (2 * 0%) – 1 = -1 | Lousy |
Breadth (N): measures the number of independent decisions made in the portfolio.
We then multiply both of them to get our Information Ratio (IR), measuring skill level over time.

If I get it right once, it doesn’t mean much. But if I am to correctly guess where all 3 coins are (high IC) consistently 100 times (high N), then I must be truly talented (high IR). Right?
Shiller: Good or lucky?
The fundamental issue is still, well, about the fundamentals. Valuations are high today, and are amongst the 80th percentile since 1995; a period that includes the dot com bubble. On top of the current environment, there are new concerns that corporate profit growth may have peaked.

Valuation ratios are mean reverting. That means over time, they converge back to their long run averages. If Earnings (the denominator) were to stay as they are, the only way for valuations to revert to its mean is for Price (the numerator) to fall at a greater magnitude. Given this context, further correction sounds almost like a certainty.
To test our ratio out, we set some parameters:
- Investments are profit making when valuations are low
- Investments are loss making when valuations are high
We purchase when valuations are at their highs (top 20%) or lows (bottom 20%) and hold them for a specified period. If the parameters we set out are right, more times than they are wrong, we will get a high Information Coefficient (IC).
Here are the results, applied on the S&P 500 Index as a proxy for the overall stock market:

| 1 Year Holding Period | 2 Years Holding Period | 3 Years Holding Period | |||||||
| Valuation | Overall | Valuation | Overall | Valuation | Overall | ||||
| Low | High | Low | High | Low | High | ||||
| % Correct | 95% | 52% | 73% | 95% | 67% | 80% | 100% | 76% | 88% |
| IC | 0.9 | 0.05 | 0.46 | 0.9 | 0.33 | 0.61 | 1 | 0.52 | 0.76 |
Information Coefficient is mostly on the higher side. Shiller PE Ratio does have predictive powers.
Investing when valuations are low almost guarantees that it will be profit making across all three holding periods tested. I believe this is because stock markets are asymmetrical, with an upward bias. There is a floor to how low prices can go until funds, institutions and other investors enter to swoop them up, supporting the prices.
Investing when valuations are high gave somewhat of a mixed result. One-year returns of high valuations gave an Information Coefficient of 0.05, not much better than a coin flip. This is because of the dot com bubble still forming at that time, providing attractive returns to investors willing to bear the risk, pushing the Shiller PE Ratio close to 38 at its peak.
In periods of high and extreme valuations, a small catalyst may set off a knee jerk reaction. Funds, institutions and individuals act to protect their personal interests, trimming their holdings or cutting their losses. This becomes a case of fastest fingers first, with rapid selling and drying liquidity pushing prices down quickly.
When the holding period is extended to 2 years or longer, then we see clearly – the odds of turning a profit during extreme high valuations are not in your favour.
What then, is the fair valuation for your odds to be decent? Here are some statistics:
| 24 years (Jan 95 – 23 Oct 18) |
Post-Dot Com Bubble (Oct 02 – 23 Oct 18) |
|
| Mean Shiller PE | 22.19 | 19.62 |
| Median Shiller PE | 21.16 | 20.49 |
| Average Top 20% | 31.98 | 24.33 |
| Average Bottom 20% | 14.87 | 14.3 |
Shiller PE ratio today: 27.02
What is going to be the catalyst? When and how much is the correction, if any? Or am I just spouting gibberish and coming FAANG (Facebook, Apple, Amazon, Netflix and Google) earnings releases are going to push the index to a new high and make me eat my own words?
This is going to be anyone’s guess!
(*Please note that information contained in this article is given for educational purposes only. Past performances are not indicative of future returns. All information and opinions provided in this piece do not constitute as investment advice.)
About the author
Tan Chek Ann
Senior Dealer
I sleep in the day and head the dealing desk at night.
In my nightly work, I attempt to do analysis, revolving around portfolio construction, long/short strategies, responsible leveraging and factors research.
Join me on my journey as I share my thoughts on various topics – though mostly still financial stuff.
Reach me at tanca@phillip.com.sg

 Back in Business: The Return of IPOs & Top Traded Counters in March 2024
  From $50 to $100: Unveiling the Impact of Inflation
  How to soar higher with Positive Carry!
  Why 2024 Offers A Small Window of Opportunity and How to Position Yourself to Capture It


