
Oversea-Chinese Banking Corp Ltd – Earnings bolstered by NIM expansion
7 Nov 2022- 3Q22 earnings of S$1.61bn were in line with our estimates. It came from higher net interest margin and net interest income offset by lower fee income. 9M22 PATMI is 73% of our FY22e forecast.
- NII grew 44% YoY underpinned by loan growth of 6% YoY and NIM surging 54bps YoY to 2.06%. Total non-interest income dipped 4% YoY as lower fee income was partly offset by higher trading and insurance income. Allowances fell 6% YoY to S$154mn.
- Maintain BUY with an unchanged target price of S$14.22. We raise FY22e earnings by 6% as we increase NII and lower provision estimates for FY22e. We assume 1.23x FY22e P/BV and ROE estimate of 10.4% in our GGM valuation. Catalysts include lower provisions and higher interest income as economic conditions improve. OCBC is our preferred pick among the three banks due to attractive valuations, upside in dividend from the 14.4% CET 1 buffer and lower provisioning as the Indonesian and Malaysian economies recover.
Results at a glance
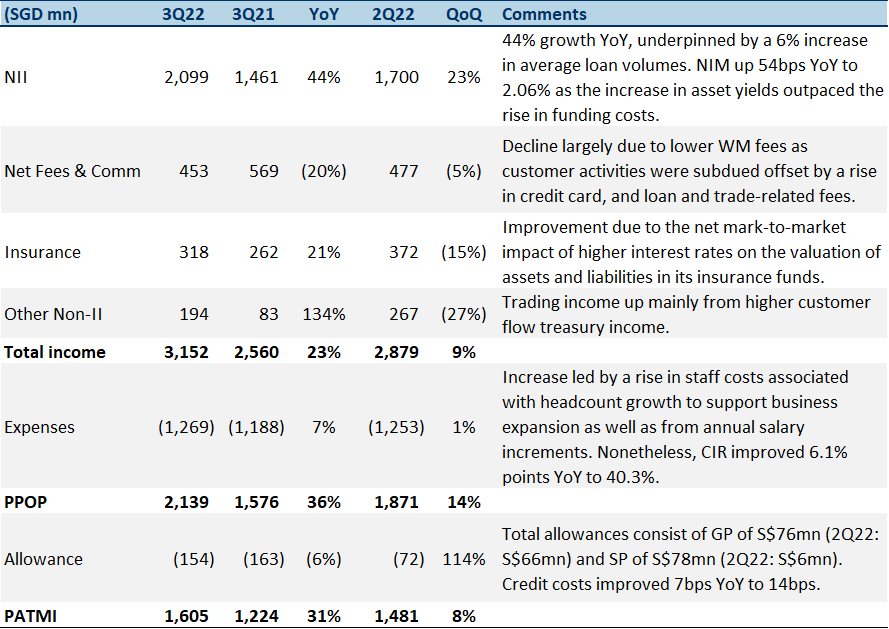
Source: Company, PSR
The Positives
+ Net interest income grew 44% YoY. NII grew 44% YoY led by loan growth of 6% YoY and NIM improvement of 54bps YoY to 2.06%. Loan growth was driven by Singapore, Indonesia and Greater China. Lending growth was broad based to the building and construction sector, financial institutions, investment and holding companies, and the consumer segment. NIM expansion was mainly due to asset yields outpacing higher funding costs amid a rapidly rising interest rate environment. OCBC has guided for similar mid-single digit loan growth and NIM of 1.80-1.90% (from 1.70%) for FY22e.
+ Insurance and trading income increase. Life insurance profit from Great Eastern Holdings rose 21% YoY, mostly due to the net mark-to-market impact of higher interest rates on the valuation of assets and liabilities in its insurance funds. Trading income also increased 134% YoY and largely comprised customer flow treasury income.
+ Allowances fell 6% YoY to S$154mn. Total allowances fell 6% YoY but were up 112% QoQ to S$154mn. GPs of S$76mn (2Q22: S$66mn) and SPs of S$78mn (2Q22: S$6mn) were made during the quarter. Total NPAs were down 7% QoQ and 13% YoY to S$3.69bn, and the NPL ratio improved by 10bps QoQ to 1.2%. Notably, there was an increase in Greater China NPLs by 18% QoQ mainly due to one Singapore based customer on a property investment. Nonetheless, OCBC has mentioned that it is a customer with low LTV and the risk is specific to that particular asset. Credit costs improved by 7bps YoY to 14bps due to the better credit environment.
The Negatives
– Fee income fell 20% YoY. Fee income declined 20% YoY to S$453mn mainly due to a drop in wealth management fees as customer activities were subdued amid risk-off investment sentiments globally. The decline was partly offset by growth in other fee segments including credit card, and loan and trade-related fees.
– CASA ratio dipped YoY. Current Account Savings Accounts (CASA) ratio fell 5.9% YoY to 56.1% mainly due to the high interest rate environment and a move towards fixed deposits (FD). Nonetheless, total customer deposits increased 6% YoY to S$353bn mainly due to the growth in FDs. The Group’s funding composition remained stable with customer deposits comprising ~80% of total funding.
Outlook
Loan growth: Loans grew 6% YoY in 3Q22 to S$303bn, meeting the bank’s guidance of a mid-single digit increase for FY22e. However, management said that it expects continued economic growth but at a slower pace due to the current economic environment. Management also sees further lending opportunities in the wholesale segment and sustainable financing. Mortgage pipelines in Singapore and Hong Kong are also healthy, with more drawdowns expected in FY22.
China: OCBC’s total exposure to mainland China remains at 11% of Group loans (S$34bn), with onshore exposure are at S$7bn and offshore exposure at S$27bn. Nonetheless, customers include mainly top state-owned enterprises, large local corporates, as well as OCBC’s network customers. Onshore China corporate real estate loans made up <1% (<S$3bn) of total loans, mainly lending to network customers. Greater China NPLs rose by 18% QoQ to S$744mn and is mainly due to one network customer name, which is highly secured with LTV at <60%.
NIM: Management has raised its NIM guidance to 1.80-1.90% for FY22e (previously 1.70%). It expects 4Q22 NIM to be above 2.10%. OCBC has also said that based on historical data, a 100bps increase in rates would lead to an 18bps increase in NIMs. Assuming rate hikes totalling 100bps this year, our FY22e NII can climb S$725mn (or 11%) resulting in an increase in our FY22e PATMI by 10%.
About the author

Glenn Thum
Research Analyst
PSR
Glenn covers the Banking and Finance sector. He has had 3 years of experience as a Credit Analyst in a Bank, where he prepared credit proposals by conducting consistent critical analysis on the business, market, country and financial information. Glenn graduated with a Bachelor of Business Management from the University of Queensland with a double major in International Business and Human Resources.
Important Information
This report is prepared and/or distributed by Phillip Securities Research Pte Ltd ("Phillip Securities Research"), which is a holder of a financial adviser’s licence under the Financial Advisers Act, Chapter 110 in Singapore.
By receiving or reading this report, you agree to be bound by the terms and limitations set out below. Any failure to comply with these terms and limitations may constitute a violation of law. This report has been provided to you for personal use only and shall not be reproduced, distributed or published by you in whole or in part, for any purpose. If you have received this report by mistake, please delete or destroy it, and notify the sender immediately.
The information and any analysis, forecasts, projections, expectations and opinions (collectively, the “Research”) contained in this report has been obtained from public sources which Phillip Securities Research believes to be reliable. However, Phillip Securities Research does not make any representation or warranty, express or implied that such information or Research is accurate, complete or appropriate or should be relied upon as such. Any such information or Research contained in this report is subject to change, and Phillip Securities Research shall not have any responsibility to maintain or update the information or Research made available or to supply any corrections, updates or releases in connection therewith.
Any opinions, forecasts, assumptions, estimates, valuations and prices contained in this report are as of the date indicated and are subject to change at any time without prior notice. Past performance of any product referred to in this report is not indicative of future results.
This report does not constitute, and should not be used as a substitute for, tax, legal or investment advice. This report should not be relied upon exclusively or as authoritative, without further being subject to the recipient’s own independent verification and exercise of judgment. The fact that this report has been made available constitutes neither a recommendation to enter into a particular transaction, nor a representation that any product described in this report is suitable or appropriate for the recipient. Recipients should be aware that many of the products, which may be described in this report involve significant risks and may not be suitable for all investors, and that any decision to enter into transactions involving such products should not be made, unless all such risks are understood and an independent determination has been made that such transactions would be appropriate. Any discussion of the risks contained herein with respect to any product should not be considered to be a disclosure of all risks or a complete discussion of such risks.
Nothing in this report shall be construed to be an offer or solicitation for the purchase or sale of any product. Any decision to purchase any product mentioned in this report should take into account existing public information, including any registered prospectus in respect of such product.
Phillip Securities Research, or persons associated with or connected to Phillip Securities Research, including but not limited to its officers, directors, employees or persons involved in the issuance of this report, may provide an array of financial services to a large number of corporations in Singapore and worldwide, including but not limited to commercial / investment banking activities (including sponsorship, financial advisory or underwriting activities), brokerage or securities trading activities. Phillip Securities Research, or persons associated with or connected to Phillip Securities Research, including but not limited to its officers, directors, employees or persons involved in the issuance of this report, may have participated in or invested in transactions with the issuer(s) of the securities mentioned in this report, and may have performed services for or solicited business from such issuers. Additionally, Phillip Securities Research, or persons associated with or connected to Phillip Securities Research, including but not limited to its officers, directors, employees or persons involved in the issuance of this report, may have provided advice or investment services to such companies and investments or related investments, as may be mentioned in this report.
Phillip Securities Research or persons associated with or connected to Phillip Securities Research, including but not limited to its officers, directors, employees or persons involved in the issuance of this report may, from time to time maintain a long or short position in securities referred to herein, or in related futures or options, purchase or sell, make a market in, or engage in any other transaction involving such securities, and earn brokerage or other compensation in respect of the foregoing. Investments will be denominated in various currencies including US dollars and Euro and thus will be subject to any fluctuation in exchange rates between US dollars and Euro or foreign currencies and the currency of your own jurisdiction. Such fluctuations may have an adverse effect on the value, price or income return of the investment.
To the extent permitted by law, Phillip Securities Research, or persons associated with or connected to Phillip Securities Research, including but not limited to its officers, directors, employees or persons involved in the issuance of this report, may at any time engage in any of the above activities as set out above or otherwise hold an interest, whether material or not, in respect of companies and investments or related investments, which may be mentioned in this report. Accordingly, information may be available to Phillip Securities Research, or persons associated with or connected to Phillip Securities Research, including but not limited to its officers, directors, employees or persons involved in the issuance of this report, which is not reflected in this report, and Phillip Securities Research, or persons associated with or connected to Phillip Securities Research, including but not limited to its officers, directors, employees or persons involved in the issuance of this report, may, to the extent permitted by law, have acted upon or used the information prior to or immediately following its publication. Phillip Securities Research, or persons associated with or connected to Phillip Securities Research, including but not limited its officers, directors, employees or persons involved in the issuance of this report, may have issued other material that is inconsistent with, or reach different conclusions from, the contents of this report.
The information, tools and material presented herein are not directed, intended for distribution to or use by, any person or entity in any jurisdiction or country where such distribution, publication, availability or use would be contrary to the applicable law or regulation or which would subject Phillip Securities Research to any registration or licensing or other requirement, or penalty for contravention of such requirements within such jurisdiction.
This report is intended for general circulation only and does not take into account the specific investment objectives, financial situation or particular needs of any particular person. The products mentioned in this report may not be suitable for all investors and a person receiving or reading this report should seek advice from a professional and financial adviser regarding the legal, business, financial, tax and other aspects including the suitability of such products, taking into account the specific investment objectives, financial situation or particular needs of that person, before making a commitment to invest in any of such products.
This report is not intended for distribution, publication to or use by any person in any jurisdiction outside of Singapore or any other jurisdiction as Phillip Securities Research may determine in its absolute discretion.
IMPORTANT DISCLOSURES FOR INCLUDED RESEARCH ANALYSES OR REPORTS OF FOREIGN RESEARCH HOUSE
Where the report contains research analyses or reports from a foreign research house, please note:
- recipients of the analyses or reports are to contact Phillip Securities Research (and not the relevant foreign research house) in Singapore at 250 North Bridge Road, #06-00 Raffles City Tower, Singapore 179101, telephone number +65 6533 6001, in respect of any matters arising from, or in connection with, the analyses or reports; and
- to the extent that the analyses or reports are delivered to and intended to be received by any person in Singapore who is not an accredited investor, expert investor or institutional investor, Phillip Securities Research accepts legal responsibility for the contents of the analyses or reports.


About the author
Glenn Thum
Research Analyst
PSR
Glenn covers the Banking and Finance sector. He has had 3 years of experience as a Credit Analyst in a Bank, where he prepared credit proposals by conducting consistent critical analysis on the business, market, country and financial information. Glenn graduated with a Bachelor of Business Management from the University of Queensland with a double major in International Business and Human Resources.
 Magnificent 7 Monthly: Apr 26 - 1Q26 earnings beat power sharp rebound
 泡泡瑪特 (9992.HK) 集中度與運營成本隱憂浮現