
US Banks - Industry leaders to benefit from peak rates
25 Mar 2024- JP Morgan, Bank of America and Wells Fargo are leaders in the US banking sector, with 40% of total assets and 32% of total deposits.
- Peak rates will boost the banks’ funding costs, as loan and security repricing is set to overtake deposit repricing. This shift will drive net interest income going forward. Credit losses have normalised to pre-pandemic levels with no alarming credit deterioration, and specific reserves for commercial real estate losses have been set aside.
- Initiate coverage on JP Morgan Chase & Co (BUY; TP US$231.19), Bank of America Corporation (ACCUMULATE; TP US$40.82) and Wells Fargo & Company (ACCUMULATE; TP US$60.83).
Investment Merits
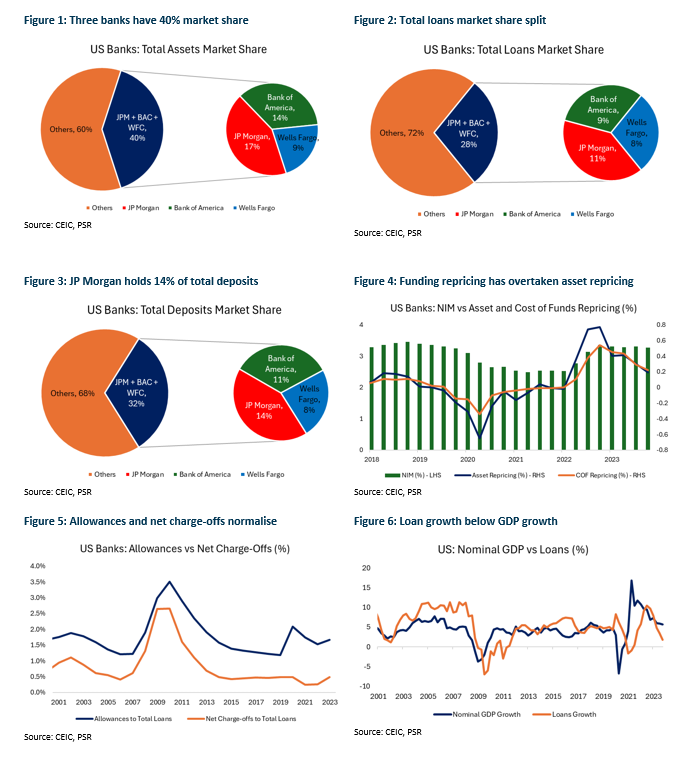
- Exceptional market share. JP Morgan, Bank of America, and Wells Fargo are the leading banks in the US, holding about 40% of the total assets in the sector (Figure 1). As of FY23, JP Morgan has the largest market share (17%), followed by Bank of America (14%) and Wells Fargo (9%). These banks also lead in loans and deposits, holding 28% (Figure 2) and 32% (Figure 3) of the market, respectively. The bank failures in 2023 increased their presence, with their share of total assets and deposits rising from 38% and 31%, respectively, in FY22. Their dominance allows them to handle a significant number of transactions and deposits across all business segments.
- Peaked rates a catalyst. The Federal Reserve’s pivot from an aggressive rate-hiking cycle to a potential rate-cutting stance in 2024 is a significant catalyst. When the Fed raised rates aggressively in early 2022, the banks were immediate beneficiaries as assets tied to benchmark lending rates were repriced to pay the banks higher rates almost immediately, and bank deposit costs lagged, resulting in higher margins at no cost. However, this reversed in 2023 as the cost of funds repricing exceeded asset repricing, resulting in dropping margins across the sector (Figure 4). With the rate reaching peak levels and potential rate cuts in 2H24, we expect asset repricing to retake the lead from deposit repricing for most banks in 2024. Lower rates can also support valuations.
- Benign provisioning cycle. Banks’ management of credit losses has normalised from the unusually low levels during the pandemic (Figure 5), with no signs of significant credit quality deterioration. Some losses are anticipated from the commercial real estate sector, but banks have been monitoring these portfolios and have set up specific loan loss reserves. Additionally, there was no over-lending in 2023, as nominal GDP growth outpaced loan growth (Figure 6).
Investment Actions
Initiation on the US Banking sector:
- BUY on JP Morgan Chase & Co (TP: US$231.19)
- ACCUMULATE on Bank of America Corporation (TP: US$40.82)
- ACCUMULATE on Wells Fargo & Company (TP: US$60.83)
JP Morgan, the largest US bank, has a diverse business portfolio and the highest international presence among the three. Its revenue is split between net interest income (56%) and non-interest income (44%). Bank of America, the second largest, leans more towards net interest income (58%) and has a predominantly US-based asset distribution (87%). Wells Fargo, the third largest by market share, stands out with its extensive branch network and a significant revenue contribution from net interest income (63%). Despite having half the assets of JP Morgan, it has nearly as many branches, indicating a strong middle-market presence and potential for deposit growth.
Comparison of the three banks (JP Morgan, Bank of America and Wells Fargo)
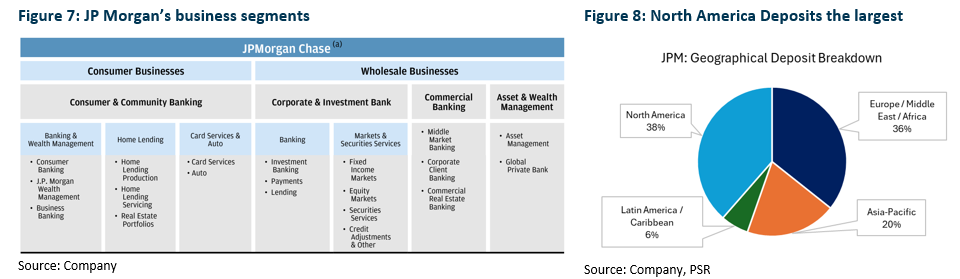
JP Morgan is the largest US bank and has held that position for more than 10 years. The bank has two main businesses: consumer businesses comprising Consumer & Community Banking (CCB), and wholesale businesses comprising Corporate & Investment Bank (CIB), Commercial Banking (CB), and Asset & Wealth Management (AWM) (Figure 7). The largest segment is CCB (43% of FY23 revenue), followed by CIB (30%), AWM (12%), and CB (10%). Net interest income makes up the majority of revenue at 56%, while non-interest income makes up 44% of FY23 revenue. JP Morgan has the highest presence outside of the US amongst the three banks; the majority of deposits are in North America (38%), with Europe/Middle East/Africa closely behind (36%), and the rest from Asia-Pacific (20%) and Latin America/Caribbean (6%) (Figure 8).
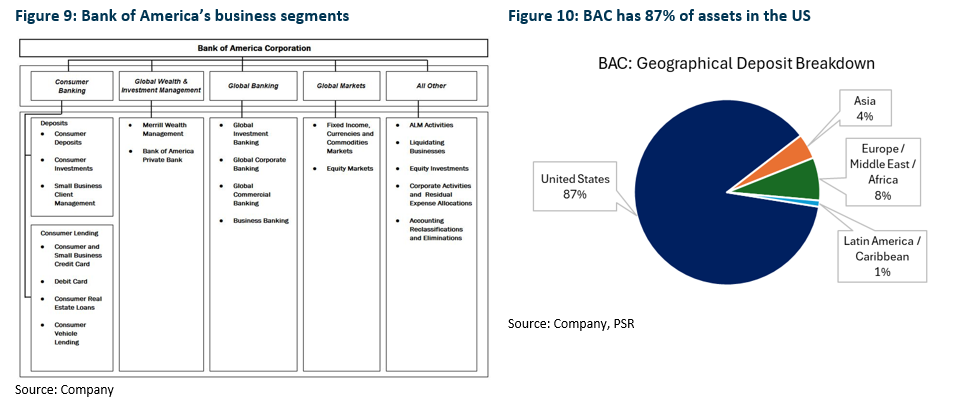
Bank of America (BAC) is the second largest US bank by total asset size. The bank has four main business segments: Consumer Banking (CB), Global Wealth & Investment Management (GWIM), Global Banking (GB), and Global Markets (GM) (Figure 9). The largest segment is CB (43% of FY23 revenue), followed by GB (25%), GWIM (21%), and GM (20%). The revenue split is leaning towards net interest income, which makes up 58% of revenue, while non-interest income makes up 42% of FY23 revenue. As for geographical segmentation, the majority of assets are in the US (87%), with the remaining 13% of assets from Europe/Middle East/Africa closely behind (8%), Asia (4%), and Latin America/Caribbean (1%) (Figure 10).
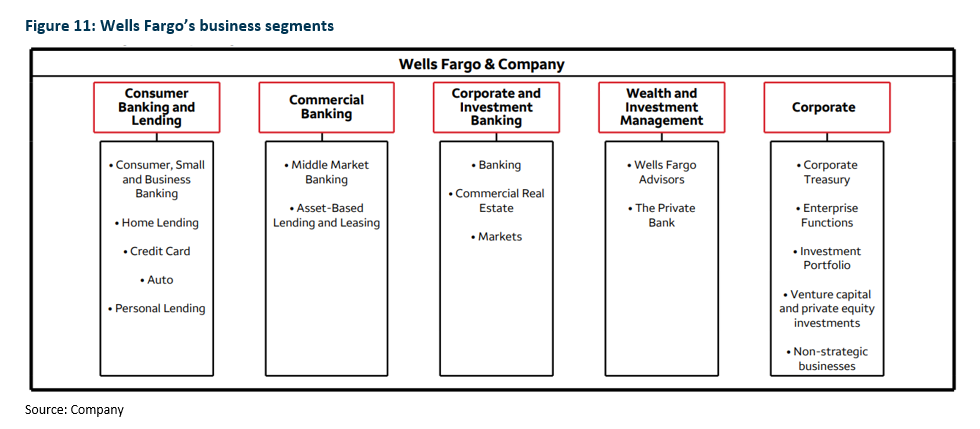
Wells Fargo is the third largest by market share and fourth largest US bank by total asset size. Wells Fargo stands out from its peers due to its extensive branch network. Despite having half the consolidated assets of JP Morgan (US$1.93tn vs US$3.88tn), Wells Fargo has nearly as many branches (4,700 vs 4,800). This large network has given Wells Fargo two major advantages: a well-established brand in the middle-market space and significant potential for deposit growth among customers. The bank has four main business segments: Consumer Banking and Lending (CBL) – 46% of FY23 revenue, Commercial Banking (CB) – 16%, Corporate and Investment Banking (CIB) – 23% and Wealth and Investment Management (WIM) – 18% (Figure 11). Revenue consists mainly of net interest income, which makes up 63% of FY23 revenue, while non-interest income makes up 37% of revenue. Wells Fargo’s exposure is mainly in the US, with the top 20 country exposure outside of the US totalling US$108bn, or less than 6% of total assets.
About the author

Glenn Thum
Research Analyst
PSR
Glenn covers the Banking and Finance sector. He has had 3 years of experience as a Credit Analyst in a Bank, where he prepared credit proposals by conducting consistent critical analysis on the business, market, country and financial information. Glenn graduated with a Bachelor of Business Management from the University of Queensland with a double major in International Business and Human Resources.
Important Information
This report is prepared and/or distributed by Phillip Securities Research Pte Ltd ("Phillip Securities Research"), which is a holder of a financial adviser’s licence under the Financial Advisers Act, Chapter 110 in Singapore.
By receiving or reading this report, you agree to be bound by the terms and limitations set out below. Any failure to comply with these terms and limitations may constitute a violation of law. This report has been provided to you for personal use only and shall not be reproduced, distributed or published by you in whole or in part, for any purpose. If you have received this report by mistake, please delete or destroy it, and notify the sender immediately.
The information and any analysis, forecasts, projections, expectations and opinions (collectively, the “Research”) contained in this report has been obtained from public sources which Phillip Securities Research believes to be reliable. However, Phillip Securities Research does not make any representation or warranty, express or implied that such information or Research is accurate, complete or appropriate or should be relied upon as such. Any such information or Research contained in this report is subject to change, and Phillip Securities Research shall not have any responsibility to maintain or update the information or Research made available or to supply any corrections, updates or releases in connection therewith.
Any opinions, forecasts, assumptions, estimates, valuations and prices contained in this report are as of the date indicated and are subject to change at any time without prior notice. Past performance of any product referred to in this report is not indicative of future results.
This report does not constitute, and should not be used as a substitute for, tax, legal or investment advice. This report should not be relied upon exclusively or as authoritative, without further being subject to the recipient’s own independent verification and exercise of judgment. The fact that this report has been made available constitutes neither a recommendation to enter into a particular transaction, nor a representation that any product described in this report is suitable or appropriate for the recipient. Recipients should be aware that many of the products, which may be described in this report involve significant risks and may not be suitable for all investors, and that any decision to enter into transactions involving such products should not be made, unless all such risks are understood and an independent determination has been made that such transactions would be appropriate. Any discussion of the risks contained herein with respect to any product should not be considered to be a disclosure of all risks or a complete discussion of such risks.
Nothing in this report shall be construed to be an offer or solicitation for the purchase or sale of any product. Any decision to purchase any product mentioned in this report should take into account existing public information, including any registered prospectus in respect of such product.
Phillip Securities Research, or persons associated with or connected to Phillip Securities Research, including but not limited to its officers, directors, employees or persons involved in the issuance of this report, may provide an array of financial services to a large number of corporations in Singapore and worldwide, including but not limited to commercial / investment banking activities (including sponsorship, financial advisory or underwriting activities), brokerage or securities trading activities. Phillip Securities Research, or persons associated with or connected to Phillip Securities Research, including but not limited to its officers, directors, employees or persons involved in the issuance of this report, may have participated in or invested in transactions with the issuer(s) of the securities mentioned in this report, and may have performed services for or solicited business from such issuers. Additionally, Phillip Securities Research, or persons associated with or connected to Phillip Securities Research, including but not limited to its officers, directors, employees or persons involved in the issuance of this report, may have provided advice or investment services to such companies and investments or related investments, as may be mentioned in this report.
Phillip Securities Research or persons associated with or connected to Phillip Securities Research, including but not limited to its officers, directors, employees or persons involved in the issuance of this report may, from time to time maintain a long or short position in securities referred to herein, or in related futures or options, purchase or sell, make a market in, or engage in any other transaction involving such securities, and earn brokerage or other compensation in respect of the foregoing. Investments will be denominated in various currencies including US dollars and Euro and thus will be subject to any fluctuation in exchange rates between US dollars and Euro or foreign currencies and the currency of your own jurisdiction. Such fluctuations may have an adverse effect on the value, price or income return of the investment.
To the extent permitted by law, Phillip Securities Research, or persons associated with or connected to Phillip Securities Research, including but not limited to its officers, directors, employees or persons involved in the issuance of this report, may at any time engage in any of the above activities as set out above or otherwise hold an interest, whether material or not, in respect of companies and investments or related investments, which may be mentioned in this report. Accordingly, information may be available to Phillip Securities Research, or persons associated with or connected to Phillip Securities Research, including but not limited to its officers, directors, employees or persons involved in the issuance of this report, which is not reflected in this report, and Phillip Securities Research, or persons associated with or connected to Phillip Securities Research, including but not limited to its officers, directors, employees or persons involved in the issuance of this report, may, to the extent permitted by law, have acted upon or used the information prior to or immediately following its publication. Phillip Securities Research, or persons associated with or connected to Phillip Securities Research, including but not limited its officers, directors, employees or persons involved in the issuance of this report, may have issued other material that is inconsistent with, or reach different conclusions from, the contents of this report.
The information, tools and material presented herein are not directed, intended for distribution to or use by, any person or entity in any jurisdiction or country where such distribution, publication, availability or use would be contrary to the applicable law or regulation or which would subject Phillip Securities Research to any registration or licensing or other requirement, or penalty for contravention of such requirements within such jurisdiction.
This report is intended for general circulation only and does not take into account the specific investment objectives, financial situation or particular needs of any particular person. The products mentioned in this report may not be suitable for all investors and a person receiving or reading this report should seek advice from a professional and financial adviser regarding the legal, business, financial, tax and other aspects including the suitability of such products, taking into account the specific investment objectives, financial situation or particular needs of that person, before making a commitment to invest in any of such products.
This report is not intended for distribution, publication to or use by any person in any jurisdiction outside of Singapore or any other jurisdiction as Phillip Securities Research may determine in its absolute discretion.
IMPORTANT DISCLOSURES FOR INCLUDED RESEARCH ANALYSES OR REPORTS OF FOREIGN RESEARCH HOUSE
Where the report contains research analyses or reports from a foreign research house, please note:
- recipients of the analyses or reports are to contact Phillip Securities Research (and not the relevant foreign research house) in Singapore at 250 North Bridge Road, #06-00 Raffles City Tower, Singapore 179101, telephone number +65 6533 6001, in respect of any matters arising from, or in connection with, the analyses or reports; and
- to the extent that the analyses or reports are delivered to and intended to be received by any person in Singapore who is not an accredited investor, expert investor or institutional investor, Phillip Securities Research accepts legal responsibility for the contents of the analyses or reports.


About the author
Glenn Thum
Research Analyst
PSR
Glenn covers the Banking and Finance sector. He has had 3 years of experience as a Credit Analyst in a Bank, where he prepared credit proposals by conducting consistent critical analysis on the business, market, country and financial information. Glenn graduated with a Bachelor of Business Management from the University of Queensland with a double major in International Business and Human Resources.
Latest Reports
 A-Sonic Aerospace Ltd - Trades below cash with buy backs underway
 Software Quarterly Update 4Q25 - Fundamentals remain intact
 名創優品 (9896.HK) 1-2 月同店超預期高增,有望驅動全年戴維斯雙擊
- MINISO (9896.HK) The strong same-store sales growth in Jan and Feb exceeded expectations, potentially driving a Davis Double Play for the full year
