Popular US Stocks traded in October 2022 November 14, 2022
Start trading on POEMS! Open a free account here!
At a glance:
- Headline inflation dropped slightly to 8.2%
- UK reversed tax cuts
- Chinese stocks tanked after Beijing’s power reshuffle
- META fell 1.8% due to poor results
The three major US indices – Dow Jones, S&P 500 and Nasdaq Composite displayed an up-trending movement from a bullish start, to a bearish mid-month and finally a higher high to end the month.
| NASDAQ | DOW JONES | S&P 500 | |
| Month Open | 10,659.01 | 28,855.25 | 3,609.78 | Month Close | 10,988.15 | 32,732.96 | 3,871.97 | Monthly return | 3.09% | 13.44% | 7.26% |
October was an erratic month that saw multiple news releases impacting the US market.
First, inflation persisted despite the Fed increasing interest rates five times this year . September’s headline inflation came in at 8.2% Year-On-Year (YOY) which was not that far off from August’s 8.3%. Although September had a lower inflation level, prices for medical care, shelter and food raised the consumer price index by 0.4% Month-On-Month (MOM) as compared to August’s 0.1% (MOM). This stubbornly high inflation paved the way for another 75 basis point rate hike.
The second was the reversal of the UK’s proposed tax cuts . The tax cuts were sending the market into a financial crisis as the requirements to fund it would involve huge borrowings and a reduction in public-spending . With the impending crisis, UK Treasury Chief Jeremy Hunt was forced to move towards a reversal to calm and assure the market of the nation’s finances.
Thirdly, Beijing’s power reshuffle caused the US’ Chinese listed stocks to slam . President Xi Jinping is the first Chinese president to serve for three consecutive terms and by staffing the cabinet with his loyalists, President Xi’s grip on power has strengthened. This did not sit well with investors’ sentiment for non-state-driven companies. Big movers including Pinduoduo dropped as much as 34%, and Alibaba fell 12%.
Finally, US GDP of 2.6% in the third quarter came in as a surprise with a higher growth than the expected 2.3% . The economic expansion was largely cosmetic and mainly attributed to net exports. The US exported more oil and natural gas due to disrupted supplies caused by the war in Ukraine. Many economists do not believe that the oil exports will sustain due to a strong USD, the weakening global economy and the fact that the US will have to top up its oil reserves at some point.
Here are some of the more popular US stocks – not ranked in any order – traded by POEMS customers in October 2022.
United Airlines (NASDAQ: UAL)
UAL reported strong earnings results with an EPS of USD 2.81, above the analysts’ forecasted value of USD 2.28 and total revenue of USD12.88 billion beating the estimate of USD12.75 billion . Due to the strong travel demand after the easing of travel restrictions,. UAL jumped 8.92% upon the release of its earnings results on Tuesday, 18th October 2022, and continued its rally with expectations of another profit in Q4 despite the challenging economy. UAL is expecting an EPS of USD 2.25 for the upcoming quarter and a strong demand due to the holiday seasons at the end of the year. In October, UAL opened at USD 32.36 and gained 33.13% to close at USD 43.08.
Technical analysis
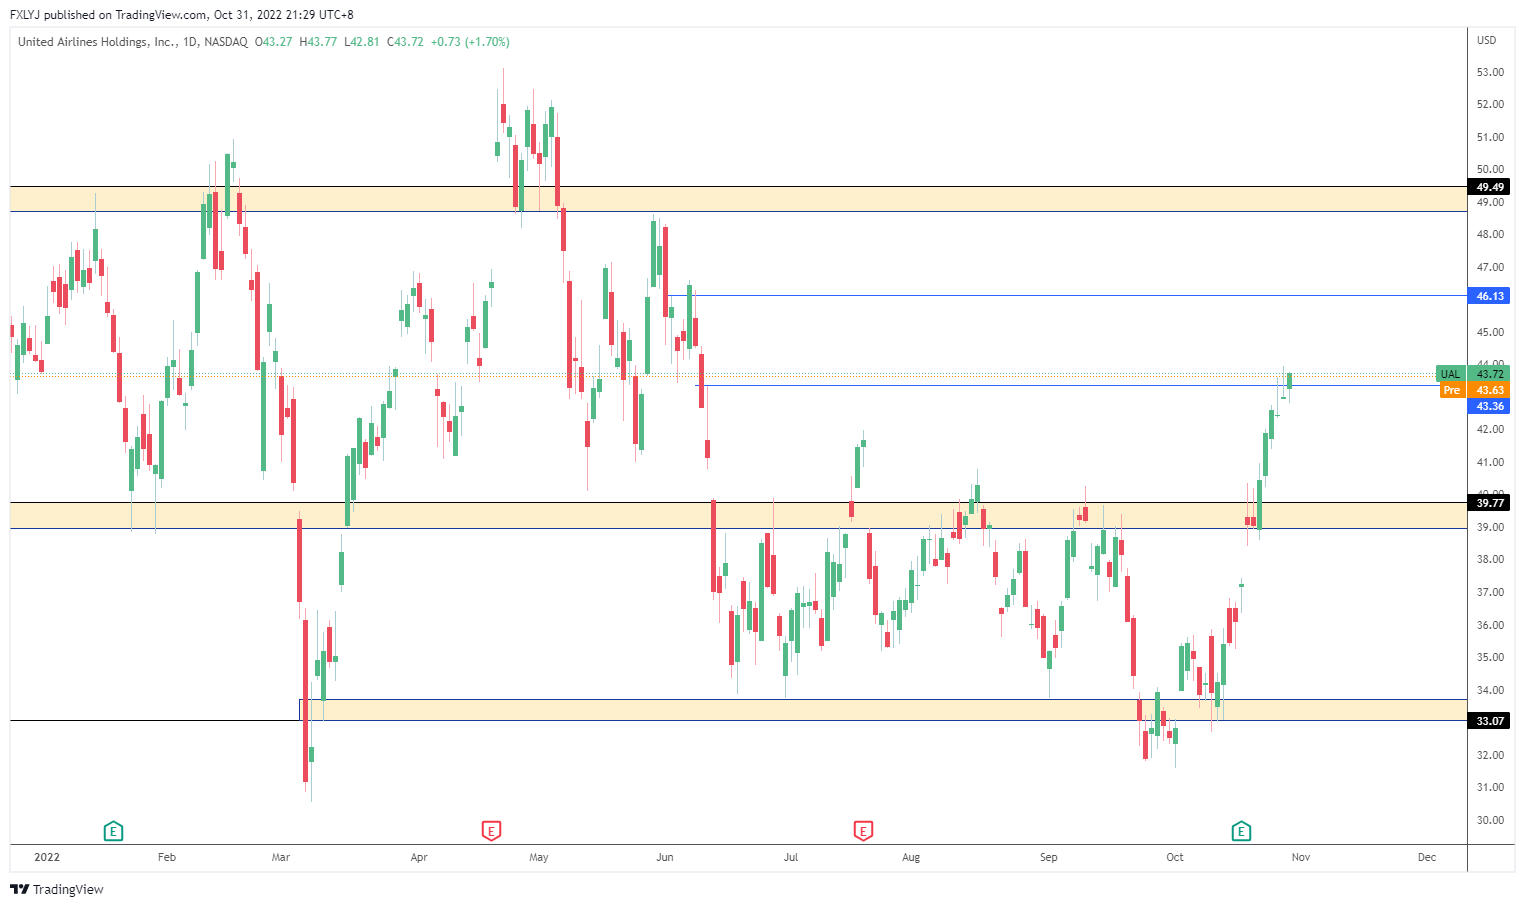
Status: Bullish
Support: USD 39.77
Resistance: USD 46.13
Bullish momentum for the past few weeks, however, we will need the price to sustain above USD 40 for more continuation
AT&T (NYSE: T)
AT&T announced strong subscriber growth, beating estimates with a reported EPS of USD 0.62 over a forecast of USD 0.62 at a 10.42% surprise profit . In addition, revenue was reported at USD 30.04 billion beating analysts’ estimates of USD 29.87 billion which was a surprise increase of 0.57%. AT&T indicated strong continued subscriber growth for Q3. Wireless service revenues and broadband revenues were up 5.6% and 6.1% respectively. Operating expenses were reduced by USD 1.1 billion compared to the same quarter a year-ago. AT&T expects wireless service revenue to continue growing at the rate of 4.5% to 5%. At the start of the month, AT&T opened at USD 15.73 and closed 15.89% above at USD 18.23.
Technical analysis
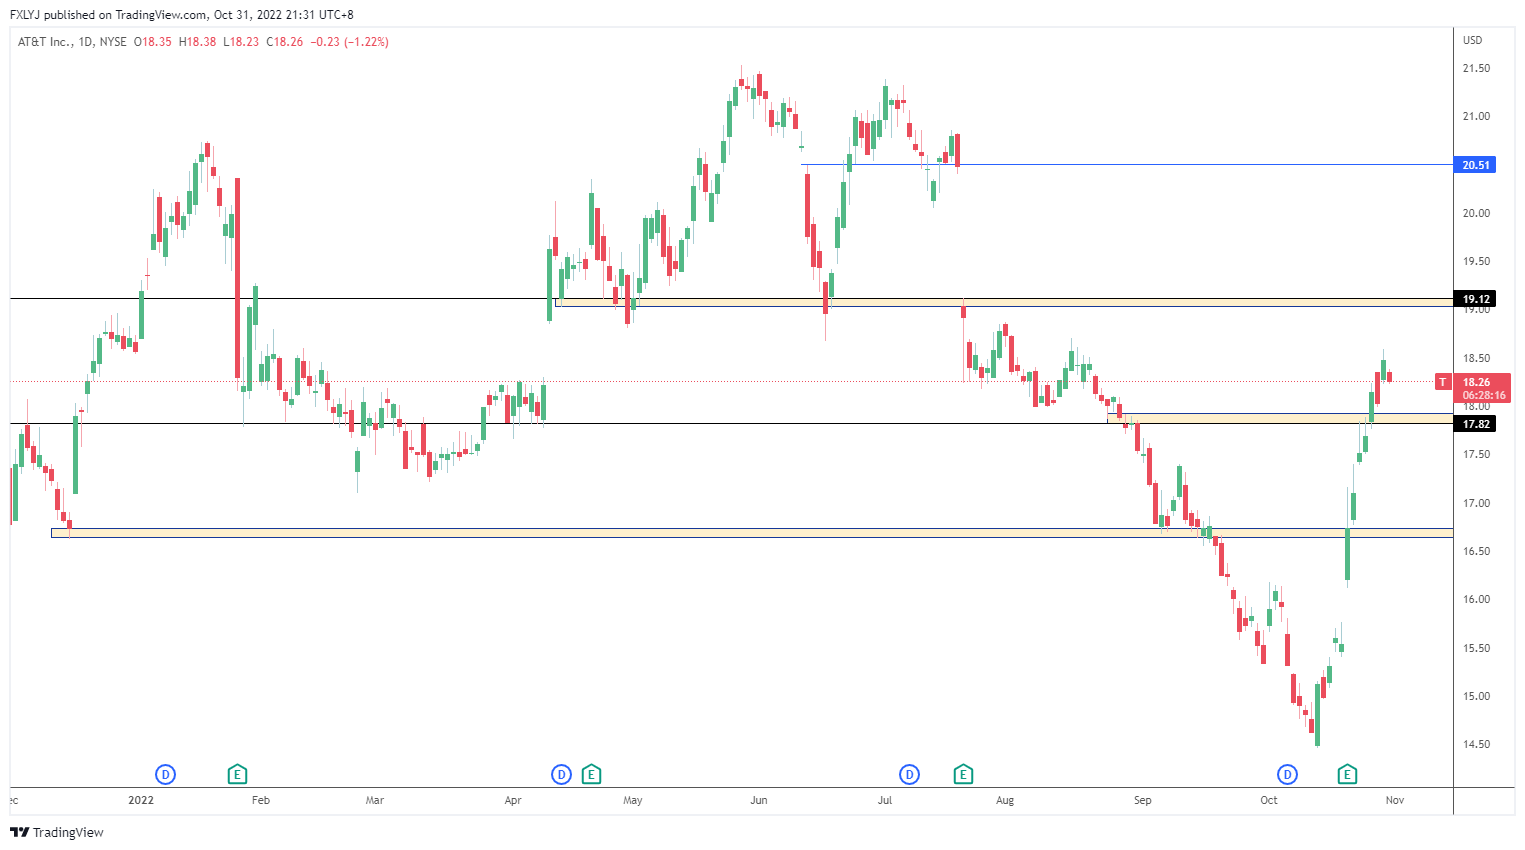
Status: Bullish
Support: USD 17.80
Resistance: USD 19.12
There was bullish momentum for the past weeks, but price has to sustain above USD17.80 for more upside.
Bank of America (NYSE: BAC)
Taking advantage of an increasing interest rate environment, BAC topped expectations with EPS reported at USD 0.81 vs expected USD 0.71. Better-than-expected revenue was also reported at USD 24.61 vs forecasted US D23.5 . This is mostly due to the increase in fixed income trading revenue compared to a year ago. Its revenue for fixed income increased by 27% to USD 2.6 billion exceeding the USD 2.24 billion estimate. Investment banking revenue continued to slip due to the current economic environment. The stock opened at USD 30.59 at the beginning of the month and gained 17.98% to close at USD 36.09.
Technical analysis
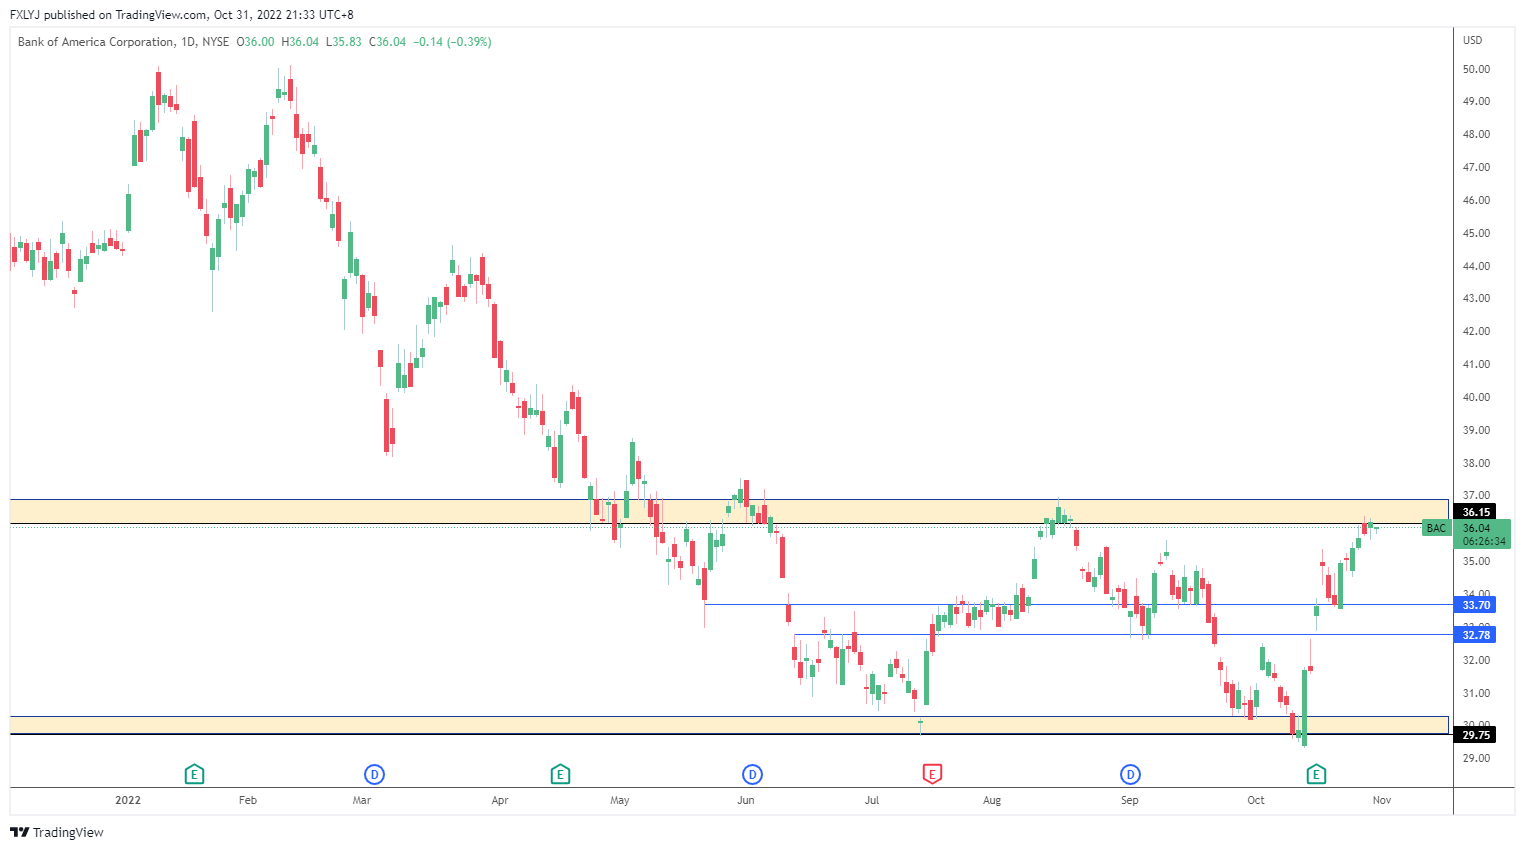
Status: Neutral
Support: USD 33.70
Resistance: USD 36.20
Range-bound
Coca-Cola co (NYSE: KO)
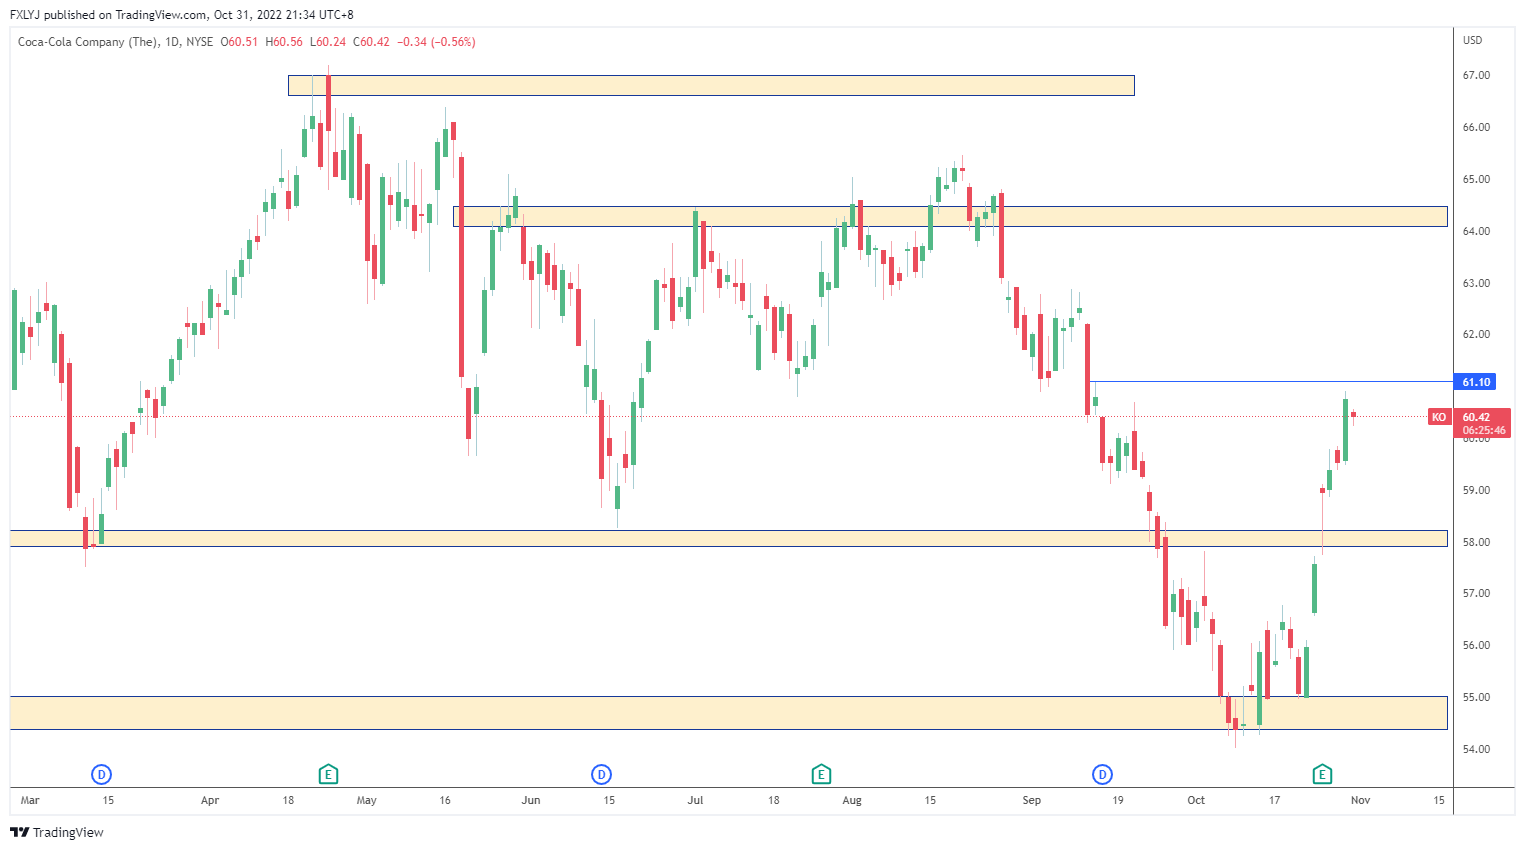
KO raised its full-year outlook, indicating that strong consumption still remains despite rising costs. KO reported strong earnings for Q3 with EPS at USD 0.69 cents vs expected USD 0.64. Revenue also came in high at USD 11.05 billion vs the forecasted USD 10.52 billion . Rising costs may pose a challenge for KO in 2023, however KO aims to continue designing value packs and provide more affordable options to encourage consumer growth. On its earnings date 25 Oct 2022, KO opened at USD 59.04 and closed lower at USD 58.95. For October, KO opened at USD 56.36 at the start of October, and closed 6.19% higher at USD 59.85.
Technical analysis
Status: Neutral
Support: USD 58
Resistance: USD 61.10
Range-bound
Visa Inc (NYSE: V)
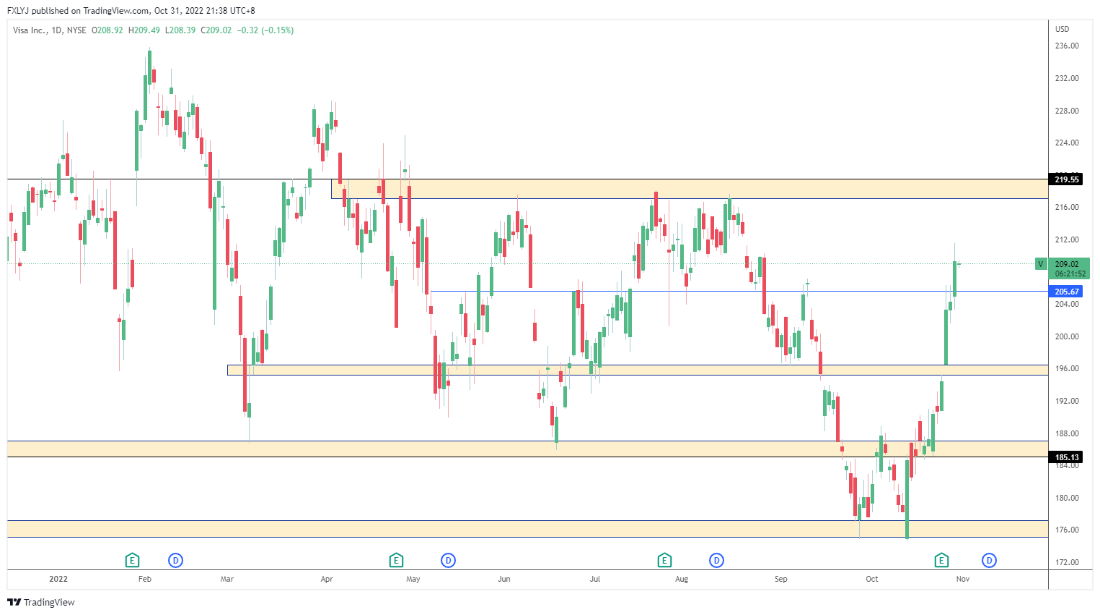
Visa Q4 earnings results beat expectations with a 3% surprise increase in both EPS and revenue. EPS was reported at USD 1.93 vs expected USD 1.86 and revenue came in at USD 7.79 billion vs the estimated USD7.55 billion . Visa earnings were said to have been boosted from the strong travel season and still resilient consumer demand. Visa soared to USD 203.33 at closing on 26 Oct 2022, increasing about 4.6% in price. After beating its earnings, Visa boosted its dividends by 20%. The rising interest rate environment will continue to pose a challenge to Visa, however the holiday season will also be an opportunity to boost Visa’s Q1 2023 earnings. At the start of the earnings season, Visa opened at USD 179.34 and gained 15.51% to close USD 207.16.
Technical analysis
Status: Bullish
Support: USD 196
Resistance: USD 220
Bullish momentum came back into a range, and price will have to continue testing USD 220 for more probability of breaking higher. Otherwise, range-bound.
Meta Platforms Inc (NASDAQ: META)
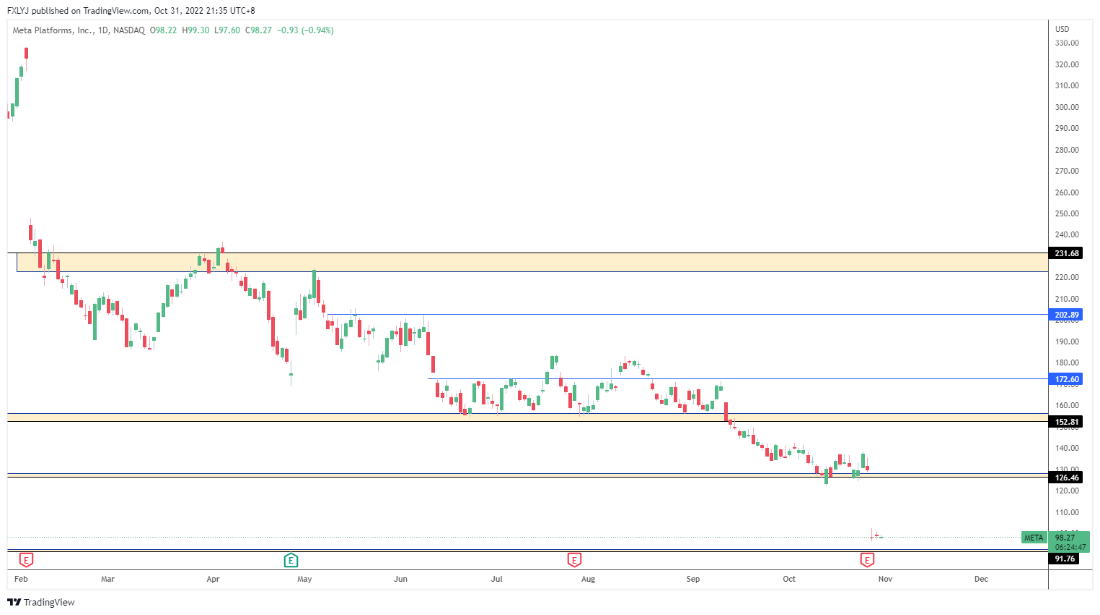
META reported disappointing Q3 earnings, and even revised its outlook for Q4. EPS came in at USD 1.64 vs expectations of USD 1.89, a miss of USD 0.25 per share. However, Revenue of USD27.71 billion met expectation of USD 27.38 billion . Since 2022, META has been on a freefall with rising operating costs which rose about 19% year over year, operating income also fell 46%. After its earnings announcement, META shares fell 20%. Chief Executive Officer Mark Zuckerberg asked investors to be patient as META’s Metaverse, business messaging and short-form videos are on the right track and due for a large payoff . It opened at USD 137.14 earlier this month, but META took a beating after its earnings announcement and closed the month at USD 135.68, down by 1.08%.
According to a Phillip Research report dated 31 Oct 2022, the recommendation for Meta stays as a Buy.
Technical analysis
Status: Neutral
Support: USD 91.50
Resistance: USD 125
Bearish right after earnings release; however, price should be ranging for now at its next immediate support at USD 91.50.
With the banking sector being a silver lining in this unpredictable market, here are 2 ETFs that track the banking industry:
Invesco KBW Regional Banking ETF (NASDAQ: KBWR)
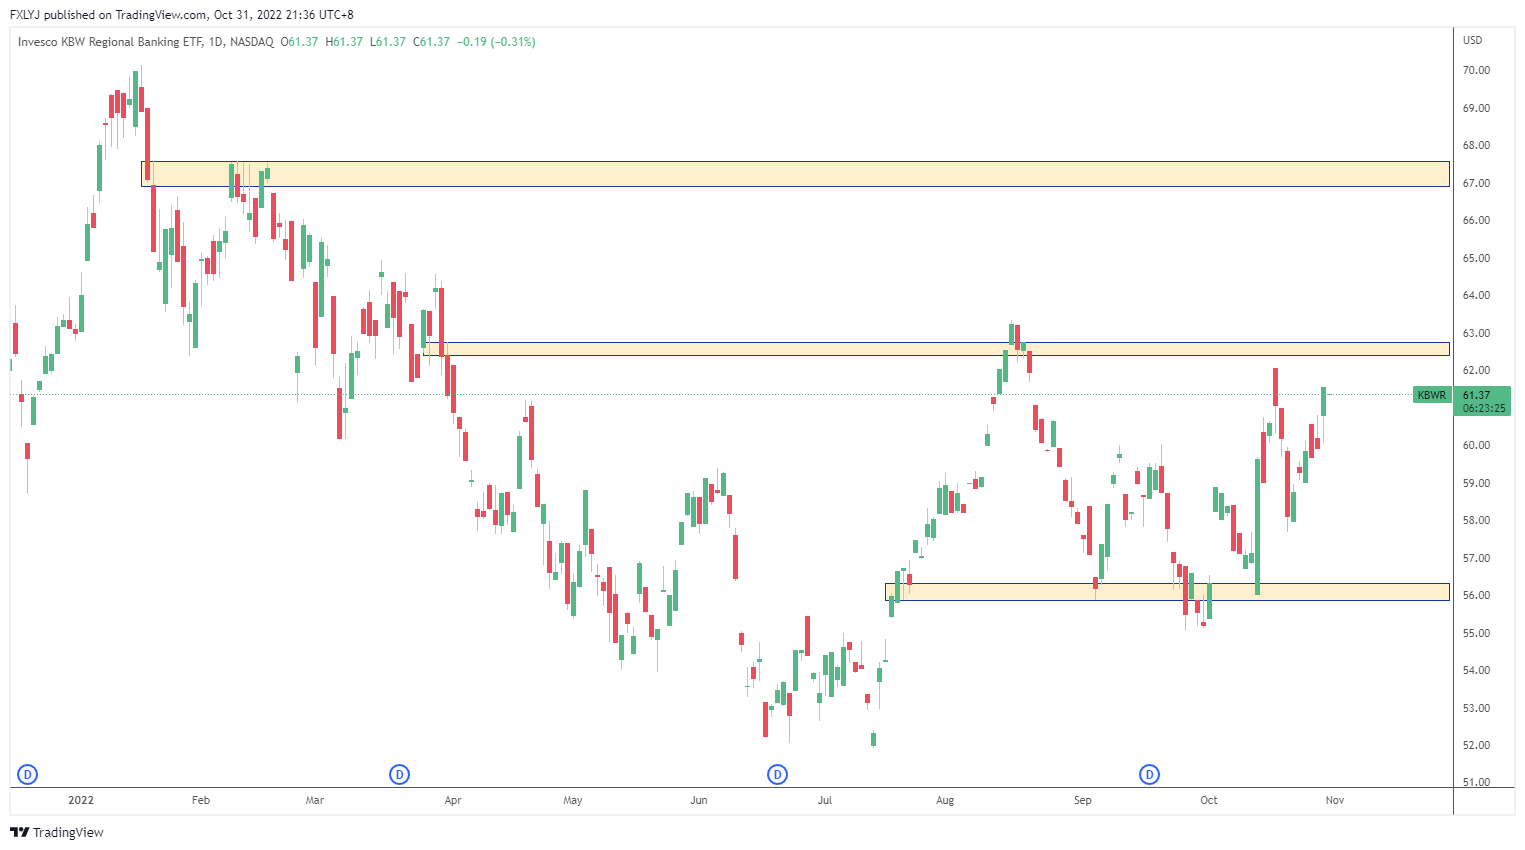
KBRW is an ETF that tracks the securities of publicly-traded US regional banking and thrift companies . The index consists primarily of companies with US regional bank activities and is a modified- market capitalisation-weighted index. KBWR commenced on 1 November 2011 with an expense ratio of 0.35%. KBWR’s year-to-date performance as of 31 October 2022 is -2.04%. KBWR opened at USD 55.39 and grew 11.48% to close at USD 61.75 in October.
Technical analysis
Status: Neutral
Support: USD56
Resistance: USD63
Range-bound
First Trust NASDAQ® ABA Community Bk ETF (NASDAQ: QABA)
QABA is an ETF that seeks investment results that correspond generally to the price and
yield of an equity index called the Nasdaq OMX® ABA Community Bank Index℠ . The index is a market capitalisation-weighted index consisting primarily of all bank common stocks listed on NASDAQ. KBWR commenced on 8 June 2009 with an expense ratio of 0.63%. QABA’s year to date performance as of 28 October 2022 is -5.27%. QABA opened at USD 51.25 and gained 9.7% to close at USD 56.22 in October.
Technical analysis
Status: Neutral
Support: USD 54.18
Resistance: USD 57.30
Range-bound
On top of the above counters, PhillipCapital’s research team, Phillip Securities Research has released a series of analysis for the follow counters:
Bloomberg analysts’ recommendations
The table below shows the consensus ratings and average ratings of all analysts updated on Bloomberg in the last 12 months. Consensus ratings have been computed by standardising analysts’ ratings from a scale of 1 (Strong Sell) to 5 (Strong Buy). The table also shows a number of analysts’ recommendations to buy, hold or sell the stocks, as well as their average target prices.
| Security | Consensus Rating | BUY | HOLD | SELL | 12 Mth Target Price (US$) |
| Visa Inc (NYSE: V) | 37 (92.5%) | 3 (7.5%) | 0 | 247.27 | 37 (92.5%) |
| Coca-Cola co (NYSE: KO) | 4.45 | 21 (72.4%) | 8 (27.6%) | 0 | 66 |
| Bank of America (NYSE: BAC) | 4.19 | 16 (59.3%) | 11 (40.7%) | 0 | 41.32 |
| Meta Platforms Inc (NASDAQ: META) | 4.02 | 38 (61.3%) | 19 (30.6%) | 5 (8.1%) | 146.43 |
| United Airlines (NASDAQ: UAL) | 3.63 | 9 (47.4%) | 7 (36.8%) | 3 (15.8%) | 52.88 |
| AT&T (NYSE: T) | 3.42 | 8 (33.3%) | 13 (54.2%) | 3 (12.5%) | 162.14 |
To round up
Based on META’s earnings report, the online advertising scene appears to be faltering. This may be a sign that companies are reducing their advertising budget to tide over this period of rising cost. Rising cost can be seen in September 2022 where the core personal consumption expenditures (PCE) price index increased by 0.5% from the previous month and 5.1% compared to a year ago . With the Fed following the core PCE closely, an increase in core PCE further influenced the Fed to proceed with a rate hike in November. However, given that housing prices in the US are starting to fall, the effect of the Fed’s tightening policy is finally being felt by the market. With this, inflation may start to creep down further in the coming months.
Get yourself educated! Join our free webinar here!

With our newly launched POEMS Mobile 3 Trading App
Explore a myriad of useful features including TradingView chartings to conduct technical analysis with over 100 technical indicators available!
Take this opportunity to expand your trading portfolio with our wide range of products including Stocks, CFDs, ETFs, Unit Trusts and more across 15 global exchanges available for you anytime and anywhere to elevate you as a better trader using our POEMS Mobile 3 App!
Reference:
- [1] “Federal Funds Rate History 1990 to 2022” 21 Sep. 2022”
- [2] “Inflation rate for September 2022: 8.2%. CPI up by 0.4% – NBC News.” 13 Oct. 2022″
- [3] “U.K. Treasury Chief Jeremy Hunt Reverses Nearly All Tax Plans to ….” 17 Oct. 2022″
- [4] “U.K. Prime Minister Liz Truss Fires Treasury Chief, U-Turns on Taxes.” 14 Oct. 2022″
- [5] “U.S.-listed Chinese stocks drop 15% after Beijing’s power reshuffle ….” 24 Oct. 2022″
- [6] “China names Xi Jinping loyalists for core leadership group – CNBC.” 23 Oct. 2022″
- [7] “U.S. GDP accelerated at 2.6% pace in Q3, better than expected as ….” 27 Oct. 2022″
- [8] “U.S. Economy Grew 2.6% in Third Quarter, GDP Report Shows – WSJ.” 28 Oct. 2022″
- [9] “United shrugs off recession fears as workers ‘untethered from the desk’ fuel travel demand” 18 Oct. 2022”
- [10] “AT&T Reports Third-Quarter Results”, 20 Oct. 2022”
- [11] “Bank of America tops estimates on better-than-expected bond trading, higher interest rates” 17 Oct. 2022”
- [12] “Coca-Cola raises full-year outlook as earnings beat expectations” 25 Oct. 2022”
- [13] “V Earnings Date“ 25 Oct. 2022”
- [14] “Meta shares plummet on weak fourth-quarter forecast and earnings miss” 26 Oct. 2022”
- [15] “Zuckerberg Asks for ‘Patience’ as Meta’s Costs Spook Investors” 28 Oct. 2022”
- [16] “Invesco KBW Regional Banking ETF”
- [17] “First Trust NASDAQ® ABA Community Bank Index Fund (QABA)”
- [18] “Key inflation gauge for the Fed rose 0.5% in September, in … – CNBC.” 28 Oct. 2022″
Disclaimer
These commentaries are intended for general circulation. It does not have regard to the specific investment objectives, financial situation and particular needs of any person who may receive this document. Accordingly, no warranty whatsoever is given and no liability whatsoever is accepted for any loss arising whether directly or indirectly as a result of any person acting based on this information. Opinions expressed in these commentaries are subject to change without notice. Investments are subject to investment risks including the possible loss of the principal amount invested. The value of the units and the income from them may fall as well as rise. Past performance figures as well as any projection or forecast used in these commentaries are not necessarily indicative of future or likely performance. Phillip Securities Pte Ltd (PSPL), its directors, connected persons or employees may from time to time have an interest in the financial instruments mentioned in these commentaries. Investors may wish to seek advice from a financial adviser before investing. In the event that investors choose not to seek advice from a financial adviser, they should consider whether the investment is suitable for them.
The information contained in these commentaries has been obtained from public sources which PSPL has no reason to believe are unreliable and any analysis, forecasts, projections, expectations and opinions (collectively the “Research”) contained in these commentaries are based on such information and are expressions of belief only. PSPL has not verified this information and no representation or warranty, express or implied, is made that such information or Research is accurate, complete or verified or should be relied upon as such. Any such information or Research contained in these commentaries are subject to change, and PSPL shall not have any responsibility to maintain the information or Research made available or to supply any corrections, updates or releases in connection therewith. In no event will PSPL be liable for any special, indirect, incidental or consequential damages which may be incurred from the use of the information or Research made available, even if it has been advised of the possibility of such damages. The companies and their employees mentioned in these commentaries cannot be held liable for any errors, inaccuracies and/or omissions howsoever caused. Any opinion or advice herein is made on a general basis and is subject to change without notice. The information provided in these commentaries may contain optimistic statements regarding future events or future financial performance of countries, markets or companies. You must make your own financial assessment of the relevance, accuracy and adequacy of the information provided in these commentaries.
Views and any strategies described in these commentaries may not be suitable for all investors. Opinions expressed herein may differ from the opinions expressed by other units of PSPL or its connected persons and associates. Any reference to or discussion of investment products or commodities in these commentaries is purely for illustrative purposes only and must not be construed as a recommendation, an offer or solicitation for the subscription, purchase or sale of the investment products or commodities mentioned.
About the author
Global Markets Desk US Dealing Team
The Global Markets Desk US Dealing team specialise in handling the US Markets in the Global Markets Desk.
Their responsibilities and capabilities extend from managing and taking orders from clients trading in the US market, to content generation, Technical Analysis and providing educational content to POEMS clients.

 Back in Business: The Return of IPOs & Top Traded Counters in March 2024
  From $50 to $100: Unveiling the Impact of Inflation
  How to soar higher with Positive Carry!
  Why 2024 Offers A Small Window of Opportunity and How to Position Yourself to Capture It


