Moving Average Indicator
Table of Contents
What is a Moving Average?
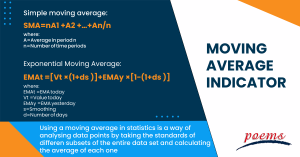
Using a moving average in statistics is a way of analysing data points by taking the standards of different subsets of the entire data set and calculating the average of each one. It is a stock indicator extensively employed in technical analysis in finance. A stock’s moving average is calculated to smooth out the price data by producing an average price that is constantly being updated.
It’s not easy to predict stock market trends. Even though it is hard to anticipate the future movement of a given stock, employing technical analysis and research can help you create more accurate predictions.
A rising moving average suggests an uptrend, whereas a falling moving average indicates a decline. Short-term moving averages crossing below longer-term moving averages is a bearish crossover, which could indicate a downward momentum.
How to calculate moving average
Simple moving average:
SMA=nA1+A2+…+An/n
where:
A=Average in period n
n=Number of time periods
Exponential Moving Average:
EMAt=[Vt×(1+ds)]+EMAy×[1−(1+ds)]
where:
EMAt=EMA today
Vt=Value today
EMAy=EMA yesterday
s=Smoothing
d=Number of days

Types of Moving Averages
Simplifying Moving Average
Simple moving average (SMA) is computed by taking the arithmetic mean of a particular set of values over a predetermined time. This form of a moving average is also the most common type. To put it another way, a group of numbers, or prices in the case of financial instruments, are summed up, and then that total is divided by the total number of prices in the group.
Moving average with an exponential scale (EMA)
An example of a moving average is the exponential moving average, which differs from other moving averages in that it lends more significance to more recent prices to make the moving average more sensitive to new information. Before you can compute an exponential moving average (EMA), you must determine the simple moving average (SMA) for a given time. The next step is to determine the multiplier used for weighting the EMA.
This factor is also known as the “smoothing factor,” and its calculation typically follows the formula [2/(selected period + 1)]. Therefore, the multiplier for a moving average of 20 days would be [2/(20+1)], which equals 0.0952. After that, you calculate the current value by adding the smoothing factor to the prior EMA and then taking the product of those two values. In light of this, the EMA assigns a greater weighting to more recent prices, whereas the SMA offers an equal weighting to all deals.
SMA vs EMA
The Exponential Moving Average, also known as the EMA, and the Simple Moving Average, often known as the SMA, measure trends similarly. The interpretation of the two averages is the same, and both of them are used frequently by technical traders to smooth out price variations. This is another reason why the two averages are comparable to one another.
The two measurements, however, do not correspond precisely to one another in every respect. The degree to which each indicator is sensitive to variations in the data it employs in its computation is the crucial distinction between a simple moving average and an exponential moving average (EMA).
The Simple Moving Average (SMA) is used to determine price averages, whereas the Exponential Moving Average (EMA) lends more weight to recent data. The most recent price information will significantly impact the moving average, while older price information will have a lesser effect.
More explicitly, the simple moving average offers equal weighting to all values, whereas the exponential moving average gives a higher weighting to recent prices.
How do traders use moving averages?
A straightforward instrument for technical analysis, the moving average (MA) helps to smooth out price data by generating an average price continuously revised. The standard is calculated over a predetermined amount of time, such as 10 days, 20 minutes, 30 weeks, or any other amount of time that the trader determines. Regarding trading, using a moving average can provide you with several benefits, and you also have choices on the moving average to apply.
Day traders looking for an edge in trading the market from both the long and short sides might find the appropriate inputs in the form of 5-, 8-, and 13-bar simple moving averages. Moving averages also function very well as filters, indicating to market participants with quick fingers when the level of risk is too high for intraday entries.
Moving average trading strategies
Trading Strategy Based on Moving Averages
The exponential moving average (EMA) is used in this particular trading technique for moving averages because of the EMA’s capacity to react rapidly to shifts in price. The strategy is as follows.
- On a chart that’s 15 minutes long, draw three exponential moving averages: one with five periods, one with 20 periods, and one with 50 periods.
- When the five-period EMA crosses from below to above the 20-period EMA and the price, five, and 20-period EMAs are above the 50-period EMA, it is an excellent time to buy the security.
- Sell when the five-period EMA crosses from above to below the 20-period EMA, and sell again when both the price and EMAs are below the 50-period EMA. This is the signal for a sell trade.
- If you are entering a buy trade, position the initial stop-loss order so that it is below the 20-period EMA; alternatively, place it approximately ten pips away from the entry price.
- When the transaction is ten pips in the black, you have the option of breaking even by moving the stop-loss order to break even.
- Think about setting a profit target of 20 pip, or another option is to pull out of the trade when the five-period drops below the 20-period if you are long or when the five-period climbs above the 20 if you are short.
Frequently Asked Questions
Moving averages, also known as MAs, are popular technical indicators used to smooth out price trends by removing the noise caused by random short-term price movements.
Calculating a simple moving average is the same as the number of periods included in the range of prices being averaged. A simple moving average is a technical indicator that can help identify whether or not a bull or bear trend will continue in an asset’s price or whether or not the trend will reverse.
When used as a general rule, an upward trend is shown when the price is higher than a moving average. A downward trend is present when a price falls below a moving average. However, because moving averages can have varying lengths (as will be covered in the following paragraph), one MA could suggest an upward trend. At the same time, another MA could indicate a downward trend.
To determine the MA, you only need to add up all the numbers in the set, then divide that sum by the total number of different values in the background. If you were to compute the moving average over five years, you would first sum up the numbers for that period and then divide that total by the number of years in the period.
Related Terms
Most Popular Terms
Other Terms
- International securities exchanges
- Settlement currency
- Federal funds rate
- Active Tranche
- Convertible Securities
- Synthetic ETF
- Physical ETF
- Initial Public Offering
- Buyback
- Secondary Sharing
- Bookrunner
- Notional amount
- Negative convexity
- Jumbo pools
- Inverse floater
- Forward Swap
- Underwriting risk
- Reinvestment risk
- Final Maturity Date
- Payment Date
- Secondary Market
- Margin Requirement
- Mark-to-market
- Pledged Asset
- Yield Pickup
- Subordinated Debt
- Trailing Stops
- Treasury Stock Method
- Stochastic Oscillator
- Bullet Bonds
- Basket Trade
- Contrarian Strategy
- Exchange Control
- Notional Value
- Relevant Cost
- Dow Theory
- Speculation
- Stub
- Trading Volume
- Going Long
- Pink sheet stocks
- Rand cost averaging
- Sustainable investment
- Stop-limit sell order
- Economic Bubble
- Ask Price
- Constant prepayment rate
- Covenants
- Stock symbol
- Companion tranche
Know More about
Tools/Educational Resources
Markets Offered by POEMS
Read the Latest Market Journal

Navigating the vast world of unit trusts can be daunting. With nearly 2000 funds available...

Predicting Trend Reversals with Candlestick Patterns for Beginners
Candlestick patterns are used to predict the future direction of price movements as they contain...

In the diverse and complex world of investing, unit trusts stand out as a popular...

Back in Business: The Return of IPOs & Top Traded Counters in March 2024
Start trading on POEMS! Open a free account here! At a glance: Major indices continue...

Weekly Updates 15/4/24 – 19/4/24
This weekly update is designed to help you stay informed and relate economic and company...

From $50 to $100: Unveiling the Impact of Inflation
In recent years, inflation has become a hot topic, evoking strong emotions as the cost...

Japan’s Economic Resurgence: Unveiling the Tailwinds Behind Nikkei 225’s Record Leap
Source: eSignal, Intercontinental Exchange, Inc. In the heart of Japan’s economic landscape, the Nikkei 225...

Weekly Updates 8/4/24 – 12/4/24
This weekly update is designed to help you stay informed and relate economic and...


