Cumulative total return
Table of Contents
Cumulative total return
If investments didn’t yield returns, why would anyone take the chance? Returns can be examined in a variety of ways.
Comparing the investment’s final value to its initial primary value, cumulative returns examine its return over a longer time frame. It serves largely as a method of analyzing an investment’s overall performance over time.
What is cumulative total return?
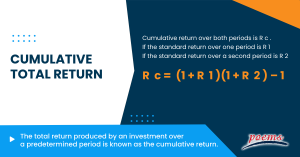
The total return produced by an investment over a predetermined period is known as the cumulative return. It is the total gain or loss on investment throughout time, regardless of the time involved.
The overall change in the investment’s price over a predetermined period is the cumulative return; this is a total return, not an annualized return. Reinvested dividends or capital gains impact an investment’s cumulative return.
This kind of return takes profits and losses from the period into account and bases the final total on the change in value from the start to the end of the same period. A cumulative return is typically shown as a percentage rather than a monetary value.
Understanding cumulative total return
Calculating the profit or loss over the purchase price makes it simple to determine the cumulative return of an asset that does not pay interest or dividends. That can be effective with assets like growth stocks and precious metals that don’t pay dividends. The cumulative return can be computed using the raw closing price.
The cumulative return of all assets can be easily calculated using the adjusted closing price. This covers investments like dividend-paying equities and bonds that pay interest. The adjusted closing price considers the impact of interest, dividends, stock splits, and other price changes on the asset. Therefore, it is possible to calculate the cumulative return by utilizing the security’s first adjusted closing price as the purchase price.
The formula for cumulative total return
The cumulative return over both periods is R c if the standard return over one period is R1 and R2 if the standard return over a second period,
Rc is equal to (1 + R1)(1 + R2) – 1
The total return is another name for the cumulative return.
Although there are ways to calculate additive cumulative returns, the cumulative return, as described here, is not additive across sub-portfolios.
How do you calculate cumulative total return?
When the cumulative rate of return is added to this equation, it becomes: (1 + RA) n = 1 + RC. Where n is the number of years taken into account in the computation of RC, RC is the cumulative rate of return, and RA is the annualized rate of return.
Using the above example, we can deduce that n = 5 and RC = 0.4. The result of fiddling with the equation is RA = [(1 + RC) (1/n)]. -1. Calculators for these mathematical issues can be found online; in this example, the yearly rate of return is 0.6961, or 6.96 percent. This is less than the inaccurate 8 percent that you would have estimated using basic math.
Using the annual compounded return as a starting point, you can compare the cumulative return with other potential investments. This can aid in your decision-making over whether to keep your money where it is currently invested or move it to a location with higher returns.
Example of cumulative total return
To better understand cumulative total return, let’s look at the following example:
Suppose you paid $10,000 for 100 shares of stock A five years ago. Your shares of stock are now worth $14,000, giving you a $4,000 increase over five years. Cumulative return is calculated as ($4,000 gain) / ($10,000 original investment) = 0.4 or 40%.
Your investment has generated a total return of 40% over the past five years. To determine which assets outperformed the others, you may compare this figure to the cumulative returns on other investments over five years. However, unless you have a straightforward loan that doesn’t compound interest, you can’t divide this number by five to achieve an annual compound return of (0.4 / 5) = 0.08, or 8 percent.
Frequently Asked Questions
The investor will use the following calculation to determine the total return rate (which is required to get the annualized return): Starting value = (ending value – beginning value)
Most investors consider an average annual return of 10% or above to be a decent ROI for long-term stock market investments.
There are a few key differences between annualized returns and cumulative returns.
- Annualized return is calculated by taking the average return over a specified period, typically one year. On the other hand, cumulative return sums up the total return over a specified period.
- Additionally, an annualized return takes into account the time value of money, meaning that it accounts for the fact that money today is worth more than money in the future. Cumulative return does not take this into account.
- Finally, the annualized return is a more accurate measure of investment performance than cumulative return since it accounts for the effects of compounding. Cumulative return does not account for compounding and can be misleading.
The simple cumulative daily return is determined by multiplying the daily percentage change by the cumulative factor.
The cumulative total return is an investment’s total return over time. This includes both the initial investment and any subsequent reinvestments. It is a measure of the overall performance of an investment.
The cumulative total return is significant because it provides a more accurate picture of an investment’s true return. It takes into account not only the initial investment but also any reinvestments that have been made. This makes it a more accurate measure of the investment’s overall performance.
The cumulative total return is a useful tool for investors because it allows them to compare the performance of different investments. It is also helpful in determining an investment portfolio’s overall risk and return.
Related Terms
- Mark-to-market
- Federal Open Market Committee
- FIRE
- Applicable federal rate
- Assets under management
- Automated teller machine
- Central limit theorem
- Balanced scorecard
- Analysis of variance
- Annual percentage rate
- Double Taxation Agreement
- Floating Rate Notes
- Average True Range (ATR)
- Constant maturity treasury
- Employee stock option
- Hysteresis
- RevPAR
- REITS
- General and administrative expenses
- OPEX
- ARPU
- WACC
- DCF
- NPL
- Capital expenditure (Capex)
- Balance of trade (BOT)
- Retail price index (RPI)
- Unit investment trust (UIT)
- SPAC
- GAAP
- GDPR
- GATT
- Irrevocable Trust
- Line of credit
- Coefficient of Variation (CV)
- Creative Destruction (CD)
- Letter of credits (LC)
- Statement of additional information
- Year to date
- Certificate of deposit
- Price-to-earnings (P/E) ratio
- Individual retirement account (IRA)
- Quantitative easing
- Yield to maturity
- Rights of accumulation (ROA)
- Letter of Intent
- Return on Invested Capital (ROIC)
- Return on Equity (ROE)
- Return on Assets (ROA)
Most Popular Terms
Other Terms
- Adjusted distributed income
- International securities exchanges
- Settlement currency
- Federal funds rate
- Active Tranche
- Convertible Securities
- Synthetic ETF
- Physical ETF
- Initial Public Offering
- Buyback
- Secondary Sharing
- Bookrunner
- Notional amount
- Negative convexity
- Jumbo pools
- Inverse floater
- Forward Swap
- Underwriting risk
- Reinvestment risk
- Final Maturity Date
- Payment Date
- Secondary Market
- Margin Requirement
- Pledged Asset
- Yield Pickup
- Subordinated Debt
- Trailing Stops
- Treasury Stock Method
- Stochastic Oscillator
- Bullet Bonds
- Basket Trade
- Contrarian Strategy
- Exchange Control
- Notional Value
- Relevant Cost
- Dow Theory
- Speculation
- Stub
- Trading Volume
- Going Long
- Pink sheet stocks
- Rand cost averaging
- Sustainable investment
- Stop-limit sell order
- Economic Bubble
- Ask Price
- Constant prepayment rate
- Covenants
- Stock symbol
- Companion tranche
Know More about
Tools/Educational Resources
Markets Offered by POEMS
Read the Latest Market Journal

Navigating the vast world of unit trusts can be daunting. With nearly 2000 funds available...

Predicting Trend Reversals with Candlestick Patterns for Beginners
Candlestick patterns are used to predict the future direction of price movements as they contain...

In the diverse and complex world of investing, unit trusts stand out as a popular...

Back in Business: The Return of IPOs & Top Traded Counters in March 2024
Start trading on POEMS! Open a free account here! At a glance: Major indices continue...

Weekly Updates 15/4/24 – 19/4/24
This weekly update is designed to help you stay informed and relate economic and company...
From $50 to $100: Unveiling the Impact of Inflation
In recent years, inflation has become a hot topic, evoking strong emotions as the cost...

Japan’s Economic Resurgence: Unveiling the Tailwinds Behind Nikkei 225’s Record Leap
Source: eSignal, Intercontinental Exchange, Inc. In the heart of Japan’s economic landscape, the Nikkei 225...

Weekly Updates 8/4/24 – 12/4/24
This weekly update is designed to help you stay informed and relate economic and...


