Net asset value per share
Table of Contents
Net asset value per share
Knowing the net asset value helps determine whether the company is undervalued or overvalued. So, investors use the NAVPS to decide whether to buy, sell, or hold a particular stock. Net asset value is one of the two critical values used to calculate a company’s intrinsic value
Just like earnings per share and market capitalization, it is one of the three key metrics to value a company. It is also one of the terms you will often hear if you are investing in stocks
Here, we explain net asset value per share and how you can use this metric to determine the value of a company.
What is net asset value per share?
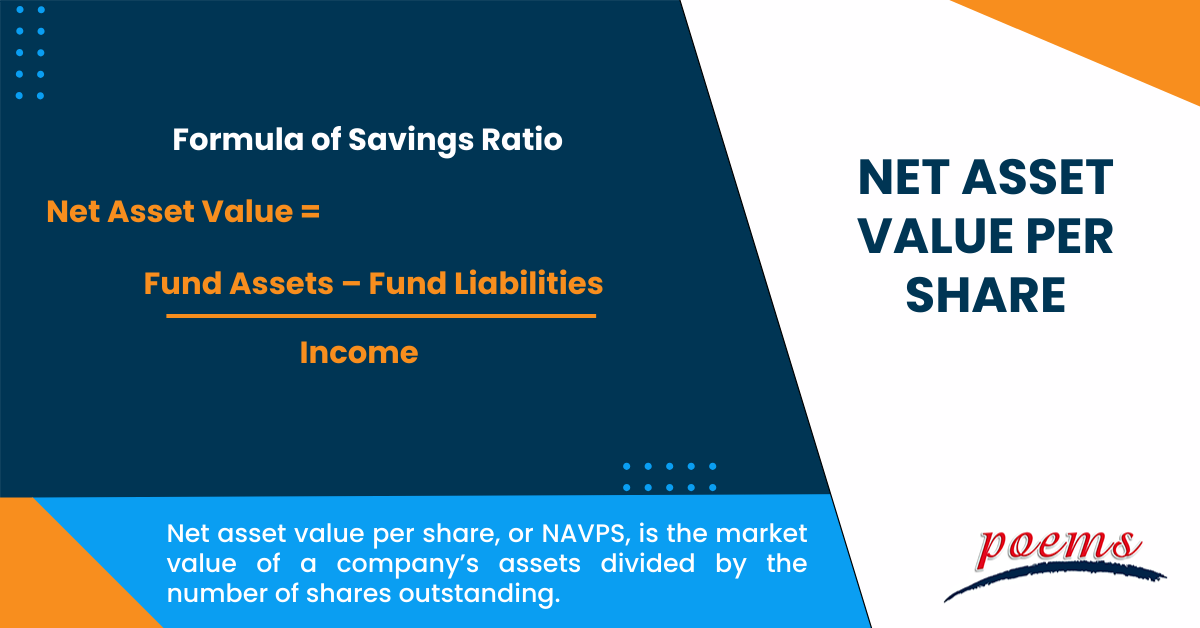
Net asset value per share, or NAVPS, is the market value of a company’s assets divided by the number of shares outstanding. The market value of assets is determined by subtracting the total liabilities from the total assets. This number is then divided by the number of shares outstanding to get the NAVPS
The NAVPS is a good indication of a company’s financial health because it shows how much each share would be worth if the company were to liquidate all of its assets and pay off all of its liabilities
A high NAVPS means that the company has a lot of assets and a low number of liabilities, which is a good sign. A low NAVPS implies that the company has a lot of liabilities and not many assets, which is not a good sign.
What is a mutual fund’s net asset value?
A mutual fund’s net asset value (NAV) is the market value of its assets minus its liabilities. The NAV per share is the mutual fund’s price
NAV is an important metric for mutual fund investors, as it is a good indicator of its performance. A fund with a high NAV is doing well, while a fund with a low NAV is not performing as well
When considering a mutual fund investment, it is important to look at the fund’s NAV and track record. A fund with a good track record but a low NAV may be in danger of underperforming, while a fund with a high NAV but a poor track record may be a better investment.
How is a fund’s net asset value calculated?

The NAV formula is simply the total value of a fund’s assets minus the total value of its liabilities. This calculation provides a snapshot of a fund’s overall worth at a given time.
Net Asset Value = Fund Assets – Fund Liabilities
——————————————————
Total number of outstanding shares
NAV is typically calculated daily, as fund values can fluctuate rapidly. However, some funds may calculate NAV weekly or monthly.
NAV in close-ended funds vs open-ended funds
Net asset value in close-ended funds versus open-ended funds have a crucial difference
With close-ended funds, the net asset value is the value of all the assets in the fund minus all the liabilities. However, with open-ended funds, the net asset value includes the value of the fund’s outstanding shares. This means that the net asset value of an open-ended fund will fluctuate as the number of outstanding shares changes.
Limitation of net asset value per share
Net asset value per share, or NAV, is a popular metric for assessing the value of a mutual fund or ETF. However, NAV has limitations that investors should be aware of.
● NAV is calculated using the fund’s assets and liabilities, which may not accurately reflect the fund’s actual value.
● NAV does not take into account the fund’s expenses, which can have a significant impact on its performance.
● NAV is a static metric that does not account for the fund’s current market conditions.
Frequently Asked Questions
To calculate net asset value from the balance sheet, you must first determine the value of the company’s assets. This can be done by adding the values of all the company’s assets, including cash, investments, property, and equipment. Once you have the total value of the company’s assets, you will then need to subtract any debts and liabilities that the company may have. The result will be the net asset value of the company.
The net asset value of a private company can be calculated by subtracting the total liabilities from the total assets. This will give you the company’s equity, which is the net asset value. The total assets and liabilities can be found on the company’s balance sheet.
Net asset value per share (NAVPS) is the value of a company’s assets divided by the number of shares outstanding, whereas share price is the price of a single share of stock. While NAVPS is a good measure of a company’s overall value, the share price is more relevant to individual investors.
There are key differences between net asset value per share (NAV) and book value per share (BVPS).
● NAV considers the market value of a company’s assets, while BVPS only looks at the historical cost of those assets. This means that NAV will be a more accurate reflection of a company’s true worth.
● NAV includes all of a company’s assets, while BVPS only consists of those considered “hard” assets. This means that NAV will give a more accurate picture of a company’s liquidity.
● NAV is calculated using a company’s total assets and liabilities, while BVPS only uses only equity. This means that NAV will be a more accurate measure of a company’s financial health
Generally, a good NAV per share is relatively high concerning the company’s share price. This indicates that the company’s assets are valuable, and the market undervalues its shares. This can be a good opportunity for investors to buy shares in the company at a discount.
Related Terms
Most Popular Terms
Other Terms
- Physical ETF
- Initial Public Offering
- Buyback
- Secondary Sharing
- Bookrunner
- Notional amount
- Negative convexity
- Jumbo pools
- Inverse floater
- Forward Swap
- Underwriting risk
- Reinvestment risk
- Final Maturity Date
- Payment Date
- Secondary Market
- Margin Requirement
- Mark-to-market
- Pledged Asset
- Yield Pickup
- Subordinated Debt
- Trailing Stops
- Treasury Stock Method
- Stochastic Oscillator
- Bullet Bonds
- Basket Trade
- Contrarian Strategy
- Exchange Control
- Notional Value
- Relevant Cost
- Dow Theory
- Speculation
- Stub
- Trading Volume
- Going Long
- Pink sheet stocks
- Rand cost averaging
- Sustainable investment
- Stop-limit sell order
- Economic Bubble
- Ask Price
- Constant prepayment rate
- Covenants
- Stock symbol
- Companion tranche
- Synthetic replication
- Bourse
- Beneficiary
- Witching Hour
- Widow and Orphan stock
- Public Float
Know More about
Tools/Educational Resources
Markets Offered by POEMS
Read the Latest Market Journal

Back in Business: The Return of IPOs & Top Traded Counters in March 2024
Start trading on POEMS! Open a free account here! At a glance: Major indices continue...

Weekly Updates 15/4/24 – 19/4/24
This weekly update is designed to help you stay informed and relate economic and company...

From $50 to $100: Unveiling the Impact of Inflation
In recent years, inflation has become a hot topic, evoking strong emotions as the cost...

Japan’s Economic Resurgence: Unveiling the Tailwinds Behind Nikkei 225’s Record Leap
Source: eSignal, Intercontinental Exchange, Inc. In the heart of Japan’s economic landscape, the Nikkei 225...

Weekly Updates 8/4/24 – 12/4/24
This weekly update is designed to help you stay informed and relate economic and...

What Makes Forex Trading Attractive?
In a world where the click of a button can send goods across oceans and...

Weekly Updates 1/4/24 – 5/4/24
This weekly update is designed to help you stay informed and relate economic and company...

How to soar higher with Positive Carry!
As US Fed interest rates are predicted to rise 6 times this year, it’s best...


