
Return on Invested Capital (ROIC)
Table of Contents
- What is ROIC?
- Formula and Calculation of ROIC
- Calculating NOPAT
- Calculating invested capital
- Determining the Value of a Company
- Determining a Company’s Competitiveness
- Relevance and Uses of Return on Invested Capital Formula
- How to Use ROIC
- ROIC vs WACC
- Value Drivers of ROIC
- Components of ROIC
- Limitations of ROIC
- Frequently Asked Questions
What is ROIC?
Return on Invested Capital (ROIC) is the amount of money a company makes that is above the average cost of its debt and equity capital. ROIC can also be assessed or used to determine the value of other businesses or rival companies.
Formula and Calculation of ROIC
The calculation of ROIC is done by dividing the net operating profit after tax (NOPAT) by the invested capital.
ROIC = NOPAT /Invested CapitalNOPATInvested Capital
ROIC can also be calculated through another method,
ROIC = Net Income − Dividends/ Debt +Equity
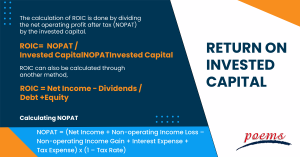
Calculating NOPAT
NOPAT is a financial measure that shows the performance of the company net of taxes. It can be calculated using the following formula;
NOPAT = (Net Income + Non-operating Income Loss – Non-operating Income Gain + Interest Expense + Tax Expense) x (1 – Tax Rate)
Calculating invested capital
Invested Capital is the total amount invested by shareholders, debt holders, and other lenders. It can be calculated by:
Invested Capital = Net Working Capital + Net Fixed Assets + Net Intangible Assets
Determining the Value of a Company
Determining the value of a company is very important to ensure proper valuation. There are various methods through which one can determine the value of a company. Some of them are:
- Asset Approach: It calculates all the assets and liabilities of a company. Then the liabilities are subtracted from the assets.
- Market Approach: It makes use of the company’s position in the stock market.
- Income Approach: It is determined by dividing the annual earnings of the company by the current capitalization rate.
Determining a Company’s Competitiveness
A company is considered to be a strong competitor if it earns more profits than its rivals. A company’s competitiveness can be determined by its market profile, customer segments, strengths, weaknesses, and position in the landscape, and method for delivering value. These aspects than can be compared with the same aspects of other companies to determine its position. Its position in the market, including respect, prices and stocks, can also be used as competitive measures
Relevance and Uses of Return on Invested Capital Formula
The ROIC formula is used in various sectors to assess how well the company has used its resources to yield maximum profit. It also has great relevance as it helps to compare the competitiveness and position of the company against its rival and how well it is doing in the sector. The formula can also be used to measure the amount of money that the company makes from its investment.
How to Use ROIC
Let’s take the example of a company UVC. If the company has generated $1,00,00,000 in profits and has invested an average of $10,00,00,000, then ROIC is said to be equal to 10%. This means that the company generates $10 of net earnings for every $100 invested in the company.
ROIC vs WACC
ROIC is the amount of money a firm makes that is above the average cost of its debt and equity capital. Weighted Average Cost of Capital (WACC) represents a company’s total cost of capital, including common stock, preferred stock, bonds, and other types of debt. If a firm is generating more ROIC than WACC, then it means that the company is creating value, and if a firm is generating more WACC than ROIC, then it means that the company is destroying value.
Value Drivers of ROIC
The value of ROIC is the product of invested capital turnover (revenue generated by each dollar spent), and margins (how much profit is retained after deducting costs). These two factors are important drivers of value when it comes to ROIC, to optimally assess profit.
Components of ROIC
ROIC has the following components:
ROIC Components = Revenue / Average Invested Capital × NOPAT / Revenue
Limitations of ROIC
While ROIC helps assess a company’s profit, it has some downsides to it. It tells us nothing about which part of the business is generating profit. It also does not take into account the holding periods of investment. There are also various possibilities of the measure being manipulated if the expected costs are not met.
Frequently Asked Questions
A good ROIC ratio is 2% or more as it indicates that the company is producing value. A score of less than 2% shows that the company is destroying value and is not utilising capital optimally.
The basic difference between ROI and ROIC is that ROIC takes into consideration every aspect of the company, including its activities. On the other hand, ROIC uses only a single activity based on cash flow and has no fixed time.
As a lower ROIC indicates an unsustainable business model, a higher ROIC is always better. A high ROIC ratio indicates that the industry is growing positively and in the right direction.
Net Income = $3,75,00,000
Total Debt = $2,50,00,000
Shareholder Equity = $65,00,000
The ROIC will be:
ROIC = 3,75,00,000 − 0/2,50,00,000 +65,00,000
= 3,75,00,000/3,15,00,000
= 1.19%
In the stock market, ROIC indicates the profits a firm has earned above the expenditures. It indicates how well a firm has used its resources or assets to generate profits.
This is because it represents recurrent core operational profits and is an unlevered measure. NOPAT is commonly employed in the numerator and is thus unaffected by the capital structure.
Related Terms
- Investment adviser public disclosure
- Price-to-Book Ratio
- Investment adviser registration depository
- Contingent deferred sales charges
- Net asset value (NAV)
- CAGR
- Mark-to-market
- Federal Open Market Committee
- FIRE
- Applicable federal rate
- Automated teller machine
- Central limit theorem
- Balanced scorecard
- Analysis of variance
- Annual Percentage rate
- Double Taxation Agreement
- Floating Rate Notes
- Average True Range (ATR)
- Constant maturity treasury
- Employee stock option
- Hysteresis
- RevPAR
- REITS
- General and administrative expenses
- OPEX
- ARPU
- WACC
- DCF
- NPL
- Capital expenditure (Capex)
- Balance of trade (BOT)
- Retail price index (RPI)
- Unit investment trust (UIT)
- SPAC
- GAAP
- GDPR
- GATT
- Irrevocable Trust
- Line of credit
- Coefficient of Variation (CV)
- Creative Destruction (CD)
- Letter of credits (LC)
- Statement of additional information
- Year to date
- Certificate of deposit
- Price-to-earnings (P/E) ratio
- Individual retirement account (IRA)
- Quantitative easing
- Yield to maturity
- Rights of accumulation (ROA)
- Letter of Intent
- Return on Equity (ROE)
- Return on Assets (ROA)
Most Popular Terms
Other Terms
- Bond Convexity
- Compound Yield
- Brokerage Account
- Discretionary Accounts
- Industry Groups
- Growth Rate
- Green Bond Principles
- Gamma Scalping
- Funding Ratio
- Free-Float Methodology
- Foreign Direct Investment (FDI)
- Floating Dividend Rate
- Flight to Quality
- Real Return
- Protective Put
- Perpetual Bond
- Option Adjusted Spread (OAS)
- Non-Diversifiable Risk
- Merger Arbitrage
- Liability-Driven Investment (LDI)
- Income Bonds
- Guaranteed Investment Contract (GIC)
- Flash Crash
- Equity Carve-Outs
- Cost of Equity
- Cost Basis
- Deferred Annuity
- Cash-on-Cash Return
- Earning Surprise
- Capital Adequacy Ratio (CAR)
- Bubble
- Beta Risk
- Bear Spread
- Asset Play
- Accrued Market Discount
- Ladder Strategy
- Junk Status
- Intrinsic Value of Stock
- Interest-Only Bonds (IO)
- Interest Coverage Ratio
- Inflation Hedge
- Industry Groups
- Incremental Yield
- Industrial Bonds
- Income Statement
- Holding Period Return
- Historical Volatility (HV)
- Hedge Effectiveness
- Flat Yield Curve
- Fallen Angel
Know More about
Tools/Educational Resources
Markets Offered by POEMS
Read the Latest Market Journal

Wee Hur Holdings Upgraded to Buy on Strong Performance and Growth Prospects
Company Overview Wee Hur Holdings Ltd is a Singapore-based company operating across three key business segments: worker dormitory operations, building construction, and property development. The company has established itself as a significant player in Singapore's infrastructure and accommodation sectors, with substantial dormitory assets and a growing construction order book. Strong Financial Performance Drives Upgrade Phillip Securities Research has upgraded Wee Hur Holdings to BUY from NEUTRAL, raising the target price to S$1.08 from S$0.90 previously. This upgrade follows exceptional 2H25 results that significantly exceeded expectations, with revenue and adjusted PATMI reaching 114% and 138% of full-year forecasts respectively. The company's adjusted PATMI surged 81% year-on-year to S$50 million in 2H25, driven by multiple growth catalysts across its business segments. The strong performance reflects successful execution of the company's diversified business model and strategic positioning in Singapore's infrastructure development. Worker Dormitory Business Anchors Growth The worker dormitory segment delivered robust performance, with Tuas View Dormitory achieving 95% occupancy compared to 93% in FY24, alongside positive rental revisions of approximately 5% year-on-year. The segment benefited significantly from Pioneer Lodge's Phase 1 operations, which added 3,088 beds representing a 20% capacity increase since May 2025. This expansion drove dormitory revenue up 21% year-on-year to S$50.8 million in 2H25. Pioneer Lodge's Phase 2, comprising 7,412 beds and representing a 39% capacity increase, received its temporary occupancy permit in 4Q25 and is expected to contribute to occupancy ramp-up in FY26. Construction Segment Shows Marked Improvement The building construction segment demonstrated remarkable turnaround, with revenue spiking 172% year-on-year to S$50 million in 2H25. Operating margins improved substantially by 10 percentage points year-on-year to -7% in FY25, compared to -17% in FY24. This improvement was driven by higher recognition of external projects, which now comprise 99% of the company's S$673 million order book, up from 59% previously. The expanded order book, growing from S$263 million in FY24, is expected to support construction segment growth through 4Q29. Strategic Portfolio Adjustments The research firm's sum-of-the-parts valuation model reflects strategic portfolio changes, including the removal of Mega@Woodlands property development and the addition of Wee Hur's 50% stake in the S$614 million Upper Thomson Road GLS site. The model also incorporates the company's estimated 20% stake in the 344-key DoubleTree by Hilton hotel and Fund III, backed by a 708-bed Australia PBSA. Future Outlook With major construction projects including Changi Airport Terminal 5 and Marina Bay Sands Integrated Resort on the horizon, analysts expect Wee Hur's 15,744-bed Tuas View Dormitory lease to be extended beyond November 2026, providing continued revenue visibility for the dormitory business. Frequently Asked Questions Q: What is Phillip Securities Research's current recommendation and target price for Wee Hur Holdings? A: Phillip Securities Research has upgraded Wee Hur Holdings to BUY from NEUTRAL, with a higher target price of S$1.08, increased from the previous target of S$0.90. Q: How did Wee Hur's 2H25 results compare to expectations? A: The company's 2H25 revenue and adjusted PATMI significantly exceeded expectations, reaching 114% and 138% of full-year forecasts respectively, with adjusted PATMI surging 81% year-on-year to S$50 million. Q: What drove the strong performance in the worker dormitory segment? A: The dormitory segment benefited from Tuas View Dormitory's improved occupancy rate of 95% and positive rental revisions of about 5% year-on-year, plus contributions from Pioneer Lodge Phase 1's additional 3,088 beds, driving dormitory revenue up 21% year-on-year to S$50.8 million. Q: How has the building construction segment's profitability changed? A: The building construction segment's operating margins improved significantly by 10 percentage points year-on-year to -7% in FY25, compared to -17% in FY24, driven by higher recognition of external projects and an expanded order book. Q: What is the current size and composition of Wee Hur's construction order book? A: The company's construction order book stands at S$673 million, up from S$263 million in FY24, with external projects now comprising 99% of the order book compared to 59% previously. This order book is expected to support growth through 4Q29. Q: When will Pioneer Lodge Phase 2 contribute to operations? A: Pioneer Lodge Phase 2, comprising 7,412 beds and representing a 39% capacity increase, received its temporary occupancy permit in 4Q25 and is expected to ramp up occupancy in FY26. Q: What major construction projects could benefit Wee Hur's dormitory business? A: Major upcoming construction projects including Changi Airport Terminal 5 and Marina Bay Sands Integrated Resort are expected to support the extension of Wee Hur's 15,744-bed Tuas View Dormitory lease beyond November 2026. Q: What changes were made to the valuation model? A: The sum-of-the-parts model removed Mega@Woodlands property development and included Wee Hur's 50% stake in the S$614 million Upper Thomson Road GLS site, plus the company's estimated 20% stake in the 344-key DoubleTree by Hilton hotel and Fund III backed by a 708-bed Australia PBSA. This article has been auto-generated using PhillipGPT. It is based on a report by a Phillip Securities Research analyst. Disclaimer These commentaries are intended for general circulation and do not have regard to the specific investment objectives, financial situation and particular needs of any person. Accordingly, no warranty whatsoever is given and no liability whatsoever is accepted for any loss arising whether directly or indirectly as a result of any person acting based on this information. You should seek advice from a financial adviser regarding the suitability of any investment product(s) mentioned herein, taking into account your specific investment objectives, financial situation or particular needs, before making a commitment to invest in such products. Opinions expressed in these commentaries are subject to change without notice. Investments are subject to investment risks including the possible loss of the principal amount invested. The value of units in any fund and the income from them may fall as well as rise. Past performance figures as well as any projection or forecast used in these commentaries are not necessarily indicative of future or likely performance. Phillip Securities Pte Ltd (PSPL), its directors, connected persons or employees may from time to time have an interest in the financial instruments mentioned in these commentaries. The information contained in these commentaries has been obtained from public sources which PSPL has no reason to believe are unreliable and any analysis, forecasts, projections, expectations and opinions (collectively the “Research”) contained in these commentaries are based on such information and are expressions of belief only. PSPL has not verified this information and no representation or warranty, express or implied, is made that such information or Research is accurate, complete or verified or should be relied upon as such. Any such information or Research contained in these commentaries are subject to change, and PSPL shall not have any responsibility to maintain the information or Research made available or to supply any corrections, updates or releases in connection therewith. In no event will PSPL be liable for any special, indirect, incidental or consequential damages which may be incurred from the use of the information or Research made available, even if it has been advised of the possibility of such damages. The companies and their employees mentioned in these commentaries cannot be held liable for any errors, inaccuracies and/or omissions howsoever caused. Any opinion or advice herein is made on a general basis and is subject to change without notice. The information provided in these commentaries may contain optimistic statements regarding future events or future financial performance of countries, markets or companies. You must make your own financial assessment of the relevance, accuracy and adequacy of the information provided in these commentaries. Views and any strategies described in these commentaries may not be suitable for all investors. Opinions expressed herein may differ from the opinions expressed by other units of PSPL or its connected persons and associates. Any reference to or discussion of investment products or commodities in these commentaries is purely for illustrative purposes only and must not be construed as a recommendation, an offer or solicitation for the subscription, purchase or sale of the investment products or commodities mentioned. This advertisement has not been reviewed by the Monetary Authority of Singapore.

TeleChoice International Ltd Maintains Growth Trajectory with Strong FY25 Performance
Company Overview TeleChoice International Ltd is a telecommunications services provider focused on personal communications systems (PCS) and network engineering services. The company operates across Southeast Asia, with significant exposure to Malaysia's telecommunications market through its partnership with U-Mobile. Financial Performance Exceeds Expectations TeleChoice delivered FY25 results that met analyst forecasts, with revenue and profit after tax and minority interests (PATMI) reaching 105% and 103% of expectations respectively. Revenue expanded substantially by 27% year-on-year to S$276 million, primarily supported by U-Mobile 4PL services. However, adjusted PATMI grew at a more modest 20% year-on-year to S$4.4 million due to inventory provisioning impacts. Shareholders benefited from a significant dividend increase, with FY25 dividends more than tripling to 0.45 cents. Personal Communications System Drives Growth The personal communications system segment remained the company's primary growth engine, with revenue surging 42% year-on-year to S$200 million. This impressive growth was fuelled by U-Mobile's expanding subscriber base and the increasing adoption of higher-value postpaid plans requiring handset subsidies. TeleChoice strategically expanded its retail footprint by increasing outlet numbers, broadening its device portfolio, and introducing additional accessories to capture greater market share. Challenges and Outlook Despite the strong revenue performance, TeleChoice faced headwinds from higher inventory provisions. The company experienced a significant spike in inventory write-downs, with provisions increasing by S$2.5 million to S$3.8 million. This provisioning was attributed to a S$11 million year-on-year rise in inventory levels during FY25, compared to S$9.3 million in FY24. Research Recommendation and Valuation Phillip Securities Research maintains its BUY recommendation on TeleChoice International, raising the target price to S$0.275 from the previous S$0.215. The firm increased its FY26e PATMI forecast by 13% to S$8.3 million. The valuation is based on a 15x price-to-earnings multiple for FY26e, benchmarked against SGX-listed companies in the system integration and software sectors. The research house noted that growth momentum in PCS remains intact, with network engineering showing signs of recovery through managed services and network buildout projects in Indonesia and Malaysia. Additionally, TeleChoice is evaluating expansion opportunities into higher-growth digital infrastructure segments, including data centres. Frequently Asked Questions Q: What were TeleChoice's key financial results for FY25? A: TeleChoice achieved revenue of S$276 million, representing 27% year-on-year growth, and adjusted PATMI of S$4.4 million, up 20% year-on-year. Results were within expectations at 105% and 103% of forecasts respectively. Q: Which business segment drove the strongest growth? A: The personal communications system (PCS) segment was the key growth driver, with revenue jumping 42% year-on-year to S$200 million, supported by U-Mobile subscriber growth and higher postpaid plans. Q: What challenges did the company face during FY25? A: TeleChoice experienced higher inventory provisions, with write-downs increasing by S$2.5 million to S$3.8 million due to a S$11 million year-on-year rise in inventory levels. Q: What is Phillip Securities Research's recommendation and target price? A: Phillip Securities Research maintains a BUY recommendation with a raised target price of S$0.275, up from the previous S$0.215, based on 15x P/E for FY26e. Q: How did dividends perform in FY25? A: FY25 dividends more than tripled to 0.45 cents, representing a 260% increase from the previous year's 0.125 cents. Q: What expansion opportunities is TeleChoice considering? A: The company announced it is evaluating expansion into higher-growth segments within digital infrastructure, including data centres, whilst network engineering is recovering through managed services and projects in Indonesia and Malaysia. Q: What factors contributed to the PCS segment's strong performance? A: Growth was driven by U-Mobile 5G subscribers, additional retail stores, postpaid handset subsidies, a widening range of devices, and expanded accessories offerings. This article has been auto-generated using PhillipGPT. It is based on a report by a Phillip Securities Research analyst. Disclaimer These commentaries are intended for general circulation and do not have regard to the specific investment objectives, financial situation and particular needs of any person. Accordingly, no warranty whatsoever is given and no liability whatsoever is accepted for any loss arising whether directly or indirectly as a result of any person acting based on this information. You should seek advice from a financial adviser regarding the suitability of any investment product(s) mentioned herein, taking into account your specific investment objectives, financial situation or particular needs, before making a commitment to invest in such products. Opinions expressed in these commentaries are subject to change without notice. Investments are subject to investment risks including the possible loss of the principal amount invested. The value of units in any fund and the income from them may fall as well as rise. Past performance figures as well as any projection or forecast used in these commentaries are not necessarily indicative of future or likely performance. Phillip Securities Pte Ltd (PSPL), its directors, connected persons or employees may from time to time have an interest in the financial instruments mentioned in these commentaries. The information contained in these commentaries has been obtained from public sources which PSPL has no reason to believe are unreliable and any analysis, forecasts, projections, expectations and opinions (collectively the “Research”) contained in these commentaries are based on such information and are expressions of belief only. PSPL has not verified this information and no representation or warranty, express or implied, is made that such information or Research is accurate, complete or verified or should be relied upon as such. Any such information or Research contained in these commentaries are subject to change, and PSPL shall not have any responsibility to maintain the information or Research made available or to supply any corrections, updates or releases in connection therewith. In no event will PSPL be liable for any special, indirect, incidental or consequential damages which may be incurred from the use of the information or Research made available, even if it has been advised of the possibility of such damages. The companies and their employees mentioned in these commentaries cannot be held liable for any errors, inaccuracies and/or omissions howsoever caused. Any opinion or advice herein is made on a general basis and is subject to change without notice. The information provided in these commentaries may contain optimistic statements regarding future events or future financial performance of countries, markets or companies. You must make your own financial assessment of the relevance, accuracy and adequacy of the information provided in these commentaries. Views and any strategies described in these commentaries may not be suitable for all investors. Opinions expressed herein may differ from the opinions expressed by other units of PSPL or its connected persons and associates. Any reference to or discussion of investment products or commodities in these commentaries is purely for illustrative purposes only and must not be construed as a recommendation, an offer or solicitation for the subscription, purchase or sale of the investment products or commodities mentioned. This advertisement has not been reviewed by the Monetary Authority of Singapore.

Singapore Banking Sector Faces Mixed Outlook as Rates Stabilise
Interest Rate Environment Shows Signs of Stabilisation Singapore's banking sector is navigating a transitional period as interest rate declines begin to moderate. Feb's 3-month Singapore Overnight Rate Average (3M-SORA) fell by just 2 basis points month-on-month to 1.16%, marking the smallest monthly decline in 20 months. Year-on-year, the rate decreased by 168 basis points, representing the smallest annual decline in eight months. This deceleration suggests that the sharp downward pressure on interest rates may be easing. The moderation in rate declines comes as Singapore continues to attract capital inflows, with foreign exchange reserves rising 10% year-on-year in Feb 2026, reinforcing the city-state's position as a regional safe haven. Meanwhile, Hong Kong's 3-month Hong Kong Interbank Offered Rate (3M-HIBOR) declined 18 basis points month-on-month to 2.69% in Feb, continuing its fourth consecutive month of decreases. Banking Performance Reflects Sector Headwinds Singapore's major banks reported fourth-quarter 2025 earnings that fell slightly below market expectations, with overall earnings declining 5% year-on-year. This performance was primarily driven by a 5% decrease in net interest income as net interest margins compressed by 22 basis points year-on-year. However, robust fee income growth of 13% helped partially offset the decline in traditional lending income. The banking sector has shown resilience through improved deposit dynamics. Current Account and Savings Account (CASA) balances rose 12% year-on-year, whilst the CASA ratio to total deposits increased to 19.8% in Dec 2025 from 19.6% previously. This improvement in low-cost funding provides banks with a cushion against margin compression and helps lower overall funding costs. Outlook and Investment Stance Phillip Securities Research maintains a NEUTRAL stance on the Singapore banking sector, acknowledging both challenges and opportunities ahead. The research house expects fiscal year 2026 profit after tax and minority interests to increase by 7% year-on-year, supported by continued fee income growth despite ongoing pressure on net interest income. Banks are providing guidance for low to mid-single digit loan growth, with Singapore loan growth continuing to climb at 6.1% as of Jan 2026. Management teams across the sector indicate that net interest margin compression should begin to ease in fiscal year 2026 as deposit rate cuts flow through and interest rates stabilise. The research highlights that increased market volatility and higher Singapore Dollar Average Volume are boosting capital markets and fee income, helping to offset traditional banking headwinds. Additionally, rising oil prices present inflation risks that could potentially delay further rate cuts, providing some support for margins. Despite asset quality concerns at United Overseas Bank, analysts view the bank's pre-emptive provisioning approach as prudent, with overall sector risks considered contained. All three major Singapore banks have committed to completing their previously announced capital return programmes, whilst dividend yields remain attractive at 5.1% with ongoing share buybacks improving return on equity. Frequently Asked Questions Q: How did Singapore banks perform in the fourth quarter of 2025? A: Fourth-quarter 2025 bank earnings were slightly below expectations, with earnings declining 5% year-on-year primarily due to lower net interest income, though this was partially offset by 13% growth in fee income. Q: What is the outlook for net interest margins in 2026? A: Banks are guiding that net interest margin compression should ease in fiscal year 2026 as deposit rate cuts begin to flow through and interest rates stabilise, following a 22 basis point year-on-year decline in the fourth quarter. Q: How are deposit trends supporting the banks? A: CASA balances rose 12% year-on-year with the CASA ratio to deposits improving to 19.8%, providing a tailwind for banks by lowering funding costs and cushioning net interest margin compression. Q: What factors could support banking margins going forward? A: Rising oil prices raise inflation risks that could potentially delay further rate cuts, whilst increased market volatility is boosting capital markets and fee income to help offset traditional banking headwinds. Q: What is the expected profit growth for Singapore banks in 2026? A: Phillip Securities Research expects fiscal year 2026 profit after tax and minority interests to increase by 7% year-on-year, as fee income growth will be partially offset by declining net interest income. Q: What are the key risks facing the banking sector? A: The main challenges include continued net interest margin compression from declining interest rates and asset quality concerns, though overall risks are viewed as contained with banks taking prudent provisioning approaches. Q: How attractive are Singapore bank dividends currently? A: Banks' dividend yields remain attractive at 5.1%, with all three major banks committed to completing their previously announced capital return plans and ongoing share buybacks improving return on equity. This article has been auto-generated using PhillipGPT. It is based on a report by a Phillip Securities Research analyst. Disclaimer These commentaries are intended for general circulation and do not have regard to the specific investment objectives, financial situation and particular needs of any person. Accordingly, no warranty whatsoever is given and no liability whatsoever is accepted for any loss arising whether directly or indirectly as a result of any person acting based on this information. You should seek advice from a financial adviser regarding the suitability of any investment product(s) mentioned herein, taking into account your specific investment objectives, financial situation or particular needs, before making a commitment to invest in such products. Opinions expressed in these commentaries are subject to change without notice. Investments are subject to investment risks including the possible loss of the principal amount invested. The value of units in any fund and the income from them may fall as well as rise. Past performance figures as well as any projection or forecast used in these commentaries are not necessarily indicative of future or likely performance. Phillip Securities Pte Ltd (PSPL), its directors, connected persons or employees may from time to time have an interest in the financial instruments mentioned in these commentaries. The information contained in these commentaries has been obtained from public sources which PSPL has no reason to believe are unreliable and any analysis, forecasts, projections, expectations and opinions (collectively the “Research”) contained in these commentaries are based on such information and are expressions of belief only. PSPL has not verified this information and no representation or warranty, express or implied, is made that such information or Research is accurate, complete or verified or should be relied upon as such. Any such information or Research contained in these commentaries are subject to change, and PSPL shall not have any responsibility to maintain the information or Research made available or to supply any corrections, updates or releases in connection therewith. In no event will PSPL be liable for any special, indirect, incidental or consequential damages which may be incurred from the use of the information or Research made available, even if it has been advised of the possibility of such damages. The companies and their employees mentioned in these commentaries cannot be held liable for any errors, inaccuracies and/or omissions howsoever caused. Any opinion or advice herein is made on a general basis and is subject to change without notice. The information provided in these commentaries may contain optimistic statements regarding future events or future financial performance of countries, markets or companies. You must make your own financial assessment of the relevance, accuracy and adequacy of the information provided in these commentaries. Views and any strategies described in these commentaries may not be suitable for all investors. Opinions expressed herein may differ from the opinions expressed by other units of PSPL or its connected persons and associates. Any reference to or discussion of investment products or commodities in these commentaries is purely for illustrative purposes only and must not be construed as a recommendation, an offer or solicitation for the subscription, purchase or sale of the investment products or commodities mentioned. This advertisement has not been reviewed by the Monetary Authority of Singapore.

Oiltek International Shows Resilient Performance Amid Order Book Challenges
Company Overview Oiltek International Ltd operates as an engineering, procurement, construction and commissioning (EPCC) contractor specialising in oil refining and renewable energy projects. The company maintains an asset-light business model with strong return on equity metrics, positioning itself as a key player in the sustainable aviation fuel and biodiesel sectors. Financial Performance and Dividend Growth The company delivered solid financial results for FY25, with adjusted profit after tax and minority interest (PATMI) reaching 101% of forecasted expectations. Whilst revenue fell short at 83% of projections, Oiltek demonstrated strong operational efficiency through improved gross margins, which climbed to 32.8% in the second half of FY25. This margin expansion reflected the proprietary nature of projects, procurement savings, and successful project completions, maintaining strength despite a stronger ringgit. The company rewarded shareholders with a 33% increase in dividend per share to 1.2 cents. Market Challenges and Strategic Positioning New orders secured during FY25 totalled RM152 million, representing a decline from the previous year's RM207 million. This softening was attributed to changes in Indonesian palm oil policies and the company's strategic pivot towards recurrent income projects. The order book decreased by 12% year-on-year to RM312.8 million from RM354.9 million, though February announcements of RM37.2 million in new contracts helped rebuild the order book to RM350 million. Growth Prospects and Market Opportunities The sustainable aviation fuel market presents significant growth opportunities, with global demand expected to surge from 1.9 million tonnes in 2025 to 7.8 million tonnes by 2030. Recent oil price increases and the drive for energy self-sufficiency are anticipated to accelerate demand for both sustainable aviation fuel and biodiesel. Oiltek is well-positioned to capitalise on these trends through EPCC contracts, ownership stakes in sustainable aviation fuel plants, and contracts in refinery and biodiesel facilities. Investment Outlook Phillip Securities Research maintains its target price of S$1.18, valuing Oiltek at 35 times FY26 price-to-earnings ratio—a premium to Malaysian listed peers reflecting the company's strong earnings growth profile. The firm expects a significant rebound in orders for FY26, driven by both refining and renewable energy projects. With a RM100 million net cash position and 35% return on equity, Oiltek maintains financial flexibility whilst operating an efficient asset-light model. Frequently Asked Questions Q: What was Oiltek's financial performance in FY25? A: Oiltek's FY25 adjusted PATMI was within expectations at 101% of forecast, though revenue was below expectations at 83% of projections. The company increased its dividend per share by 33% to 1.2 cents. Q: How did Oiltek's gross margins perform? A: Gross margins improved significantly, climbing to 32.8% in 2H25, up from 27.4% previously. This 5.4 percentage point increase was driven by procurement savings, project completions, and the proprietary nature of projects. Q: What caused the decline in new orders? A: New orders fell to RM152 million in FY25 from RM207 million in FY24, primarily due to changes in Indonesian palm oil policies and the company's strategic pivot towards recurrent income projects. Q: What is the current status of Oiltek's order book? A: The order book declined 12% year-on-year to RM312.8 million, but recovered to RM350 million in February 2026 following the announcement of RM37.2 million in new contracts. Q: What growth opportunities does Oiltek face? A: The company is positioned to benefit from surging sustainable aviation fuel demand, expected to grow from 1.9 million tonnes in 2025 to 7.8 million tonnes by 2030, alongside opportunities in biodiesel and refinery projects. Q: What is Phillip Securities Research's recommendation? A: The research house maintains a target price of S$1.18, valuing Oiltek at 35 times FY26 PE ratio—a premium to Malaysian peers due to strong earnings growth prospects. Q: What are Oiltek's key financial strengths? A: The company maintains an asset-light business model with a 35% return on equity and holds RM100 million in net cash, providing financial flexibility for future growth opportunities. This article has been auto-generated using PhillipGPT. It is based on a report by a Phillip Securities Research analyst. Disclaimer These commentaries are intended for general circulation and do not have regard to the specific investment objectives, financial situation and particular needs of any person. Accordingly, no warranty whatsoever is given and no liability whatsoever is accepted for any loss arising whether directly or indirectly as a result of any person acting based on this information. You should seek advice from a financial adviser regarding the suitability of any investment product(s) mentioned herein, taking into account your specific investment objectives, financial situation or particular needs, before making a commitment to invest in such products. Opinions expressed in these commentaries are subject to change without notice. Investments are subject to investment risks including the possible loss of the principal amount invested. The value of units in any fund and the income from them may fall as well as rise. Past performance figures as well as any projection or forecast used in these commentaries are not necessarily indicative of future or likely performance. Phillip Securities Pte Ltd (PSPL), its directors, connected persons or employees may from time to time have an interest in the financial instruments mentioned in these commentaries. The information contained in these commentaries has been obtained from public sources which PSPL has no reason to believe are unreliable and any analysis, forecasts, projections, expectations and opinions (collectively the “Research”) contained in these commentaries are based on such information and are expressions of belief only. PSPL has not verified this information and no representation or warranty, express or implied, is made that such information or Research is accurate, complete or verified or should be relied upon as such. Any such information or Research contained in these commentaries are subject to change, and PSPL shall not have any responsibility to maintain the information or Research made available or to supply any corrections, updates or releases in connection therewith. In no event will PSPL be liable for any special, indirect, incidental or consequential damages which may be incurred from the use of the information or Research made available, even if it has been advised of the possibility of such damages. The companies and their employees mentioned in these commentaries cannot be held liable for any errors, inaccuracies and/or omissions howsoever caused. Any opinion or advice herein is made on a general basis and is subject to change without notice. The information provided in these commentaries may contain optimistic statements regarding future events or future financial performance of countries, markets or companies. You must make your own financial assessment of the relevance, accuracy and adequacy of the information provided in these commentaries. Views and any strategies described in these commentaries may not be suitable for all investors. Opinions expressed herein may differ from the opinions expressed by other units of PSPL or its connected persons and associates. Any reference to or discussion of investment products or commodities in these commentaries is purely for illustrative purposes only and must not be construed as a recommendation, an offer or solicitation for the subscription, purchase or sale of the investment products or commodities mentioned. This advertisement has not been reviewed by the Monetary Authority of Singapore.

Geo Energy Resources Poised for Strong Growth Despite Tax Rate Challenges
Company Overview Geo Energy Resources Ltd is a coal mining company operating in Indonesia, with multiple mining assets including PT Tanah Bumbu Resources (TBR), PT Triaryani (TRA), and PT Sungai Danau Jaya (SDJ) mines. The company is focused on expanding its production capacity and developing new infrastructure to support its growth ambitions. Mixed FY25 Performance Results Geo Energy Resources delivered mixed results for FY25, with revenue performance exceeding expectations whilst earnings fell short of forecasts. The company achieved FY25 revenue and profit after tax and minority interests (PATMI) of 113% and 70% of Phillip Securities Research's FY25 estimates respectively. However, earnings were significantly impacted by an unexpected surge in the effective tax rate. Tax Rate Challenges Impact Profitability The most significant headwind facing Geo Energy was a dramatic increase in its effective tax rate, which spiked to 63% compared to the estimated 22%. This substantial deviation occurred due to Indonesian authorities changing the basis for taxable income calculations. The new methodology uses the domestic Harga Patokan Batubara (HPB) coal price rather than Geo's actual export prices. The HPB price was unusually elevated during June-July, creating a much larger gap than the typical US$1-2 difference, thereby significantly increasing the company's tax burden. Strong Production Growth and Infrastructure Development Despite the tax challenges, Geo Energy demonstrated robust operational performance. Coal production in the second half of FY25 jumped 20% year-on-year to 5.9 million tonnes. This increase was primarily driven by stronger output from the TBR mine, which contributed an additional 1.1 million tonnes, and TRA mine, which added 0.4 million tonnes. However, SDJ mine production declined by 0.5 million tonnes to 0.3 million tonnes and is expected to cease production in 2026. The company is making significant progress on its major infrastructure project - a 92-kilometre hauling road and jetty costing US$190 million. This critical infrastructure is currently 80% complete and will undergo testing and commissioning from April 2026, with commercial usage planned for August-September. Phillip Securities Research models that 2.5 million tonnes of coal will be shipped through this new infrastructure in the fourth quarter of 2026. Analyst Outlook and Recommendations Phillip Securities Research maintains its BUY recommendation for Geo Energy Resources and has raised its DCF target price to S$0.75 from the previous S$0.59. This price increase reflects a reduction in the infrastructure discount from 60% to 50%. The research house maintains its FY26 earnings estimates and identifies what it calls a "trifecta boost" in earnings potential from recovering coal prices, doubled coal production capacity, and new fee income from road usage and transportation services. The analysts forecast production to remain stable at 12 million tonnes in FY26, before spiking significantly to 20 million tonnes in FY27. Supporting this optimistic outlook, coal prices are showing signs of recovery, moving from the US$40s to the US$50s range. Frequently Asked Questions Q: What was Geo Energy's FY25 financial performance compared to expectations? A: FY25 revenue exceeded expectations at 113% of forecasts, but earnings disappointed at only 70% of estimates due to a significant increase in the effective tax rate from an estimated 22% to 63%. Q: Why did the effective tax rate increase so dramatically? A: Indonesian authorities changed the taxable income computation method, using the domestic Harga Patokan Batubara (HPB) coal price rather than Geo Energy's actual export prices. The HPB price was unusually high during June-July, creating a much larger tax burden than the typical US$1-2 difference. Q: How did coal production perform in 2H25? A: Coal production jumped 20% year-on-year to 5.9 million tonnes in the second half of FY25, primarily driven by increases from TBR mine (+1.1mn tonnes) and TRA mine (+0.4mn tonnes), whilst SDJ mine production fell by 0.5mn tonnes. Q: What is the status of Geo Energy's major infrastructure project? A: The 92-kilometre US$190 million hauling road and jetty is 80% complete. Testing and commissioning will begin in April 2026, with commercial usage planned for August-September 2026. Q: What is Phillip Securities Research's recommendation and target price? A: Phillip Securities Research maintains a BUY recommendation and has raised the DCF target price to S$0.75 from the previous S$0.59, reflecting a reduction in the infrastructure discount from 60% to 50%. Q: What are the production forecasts for FY26 and FY27? A: Production is forecast to remain stable at 12 million tonnes in FY26, then spike significantly to 20 million tonnes in FY27 as the new infrastructure becomes operational. Q: How are coal prices performing? A: Coal prices are showing signs of recovery, moving from the US$40s to the US$50s range, which supports the positive outlook for the company. Q: What is the "trifecta boost" mentioned by analysts? A: The trifecta boost refers to three factors expected to drive earnings growth: rebounding coal prices, a doubling of coal production capacity, and new fee income from road usage and transportation services. This article has been auto-generated using PhillipGPT. It is based on a report by a Phillip Securities Research analyst. Disclaimer These commentaries are intended for general circulation and do not have regard to the specific investment objectives, financial situation and particular needs of any person. Accordingly, no warranty whatsoever is given and no liability whatsoever is accepted for any loss arising whether directly or indirectly as a result of any person acting based on this information. You should seek advice from a financial adviser regarding the suitability of any investment product(s) mentioned herein, taking into account your specific investment objectives, financial situation or particular needs, before making a commitment to invest in such products. Opinions expressed in these commentaries are subject to change without notice. Investments are subject to investment risks including the possible loss of the principal amount invested. The value of units in any fund and the income from them may fall as well as rise. Past performance figures as well as any projection or forecast used in these commentaries are not necessarily indicative of future or likely performance. Phillip Securities Pte Ltd (PSPL), its directors, connected persons or employees may from time to time have an interest in the financial instruments mentioned in these commentaries. The information contained in these commentaries has been obtained from public sources which PSPL has no reason to believe are unreliable and any analysis, forecasts, projections, expectations and opinions (collectively the “Research”) contained in these commentaries are based on such information and are expressions of belief only. PSPL has not verified this information and no representation or warranty, express or implied, is made that such information or Research is accurate, complete or verified or should be relied upon as such. Any such information or Research contained in these commentaries are subject to change, and PSPL shall not have any responsibility to maintain the information or Research made available or to supply any corrections, updates or releases in connection therewith. In no event will PSPL be liable for any special, indirect, incidental or consequential damages which may be incurred from the use of the information or Research made available, even if it has been advised of the possibility of such damages. The companies and their employees mentioned in these commentaries cannot be held liable for any errors, inaccuracies and/or omissions howsoever caused. Any opinion or advice herein is made on a general basis and is subject to change without notice. The information provided in these commentaries may contain optimistic statements regarding future events or future financial performance of countries, markets or companies. You must make your own financial assessment of the relevance, accuracy and adequacy of the information provided in these commentaries. Views and any strategies described in these commentaries may not be suitable for all investors. Opinions expressed herein may differ from the opinions expressed by other units of PSPL or its connected persons and associates. Any reference to or discussion of investment products or commodities in these commentaries is purely for illustrative purposes only and must not be construed as a recommendation, an offer or solicitation for the subscription, purchase or sale of the investment products or commodities mentioned. This advertisement has not been reviewed by the Monetary Authority of Singapore.

China Aviation Oil Sees Strong Recovery with Soaring Jet Fuel Volumes and Expanding Margins
Company Overview China Aviation Oil (CAO) operates as a leading jet fuel supplier and trader, serving as a critical link in China's aviation fuel supply chain. The company's business model centres on jet fuel supply and trading activities, with significant exposure to China's aviation recovery through its associate Shanghai Pudong International Airport. Exceptional Financial Performance CAO delivered impressive results in the second half of 2025, with profit after tax and minority interests (PATMI) exceeding expectations at 55% and 77% of full-year forecasts respectively. The company demonstrated remarkable operational efficiency as gross profit surged 140% year-on-year to US$42.4 million in 2H25, despite revenue declining 1.3% to US$7.9 billion due to lower oil prices. Strong Volume Growth Drives Recovery The company's operational metrics reflect China's robust aviation recovery. Total supply and trading volumes increased 3.4% year-on-year to 12.15 million metric tonnes in 2H25, whilst jet fuel volumes rose significantly by 15.3% to 8.8 million metric tonnes. This growth was underpinned by China's passenger volume recovery, which increased 5.5% to 770 million passengers, with international route passengers surging 21.6% to 79.7 million. Shanghai Pudong International Airport (SPIA) remained a cornerstone of profitability, contributing US$31.9 million in 2H25 profits—44.6% higher year-on-year and representing 52.6% of total PATMI. Key Positives Driving Performance The margin expansion story reflects two critical factors: enhanced negotiating power from higher jet fuel volumes enabling better spread negotiations and improved fixed cost absorption across a larger supply base. Additionally, potential increases in sustainable aviation fuel (SAF) volumes, which carry margins three to five times higher than conventional jet fuel, contributed to profitability improvements. CAO maintains a fortress balance sheet with US$686.9 million in cash and no debt, providing strategic flexibility for dividend increases and investments. Research Outlook Phillip Securities Research maintains a BUY rating with an upgraded target price of S$2.53, previously S$1.50. The research house increased FY26 PATMI forecasts by 32% to account for continued air travel recovery and SPIA's Terminal 3 expansion, which will increase passenger handling capacity by approximately 62.5%. Frequently Asked Questions Q: What drove CAO's strong financial performance in 2H25? A: Jet fuel volumes increased 15.3% year-on-year to 8.8 million metric tonnes, whilst gross profit surged 140% to US$42.4 million due to margin expansion and higher refuelling volumes supported by China's passenger volume recovery. Q: How significant is Shanghai Pudong International Airport to CAO's profitability? A: SPIA contributed US$31.9 million in 2H25 profits, representing 44.6% higher year-on-year growth and accounting for 52.6% of CAO's total PATMI in the period. Q: What is Phillip Securities Research's recommendation and target price? A: Phillip Securities Research maintains a BUY rating with an upgraded target price of S$2.53, increased from the previous S$1.50, representing a 32% increase in FY26 PATMI forecasts. Q: Why did margins expand despite lower oil prices? A: Margin expansion resulted from higher jet fuel volumes enabling better spread negotiation and fixed cost absorption, plus potential increases in sustainable aviation fuel volumes, which carry margins three to five times higher than conventional jet fuel. Q: What is CAO's financial position? A: CAO maintains a strong net cash position of US$686.9 million with no debt, providing flexibility for dividend increases and strategic investments. Cash balance grew US$186.7 million in FY25 due to strong operating cash flows of US$150.5 million. Q: What growth drivers support the upgraded forecasts? A: Growth will arise from higher passenger volumes following SPIA's Terminal 3 expansion, which increases passenger handling capacity by approximately 62.5%, and strategic investments supporting the growing SAF business. Q: How did passenger recovery impact CAO's operations?? A: China's passenger volumes increased 5.5% to 770 million, with international route passengers surging 21.6% to 79.7 million, directly supporting the 15.3% increase in jet fuel volumes. Q: What role does sustainable aviation fuel play in CAO's strategy? A: SAF volumes are expected to grow alongside international travel recovery and carry margins three to five times better than conventional jet fuel, contributing to the company's profitability expansion. This article has been auto-generated using PhillipGPT. It is based on a report by a Phillip Securities Research analyst. Disclaimer These commentaries are intended for general circulation and do not have regard to the specific investment objectives, financial situation and particular needs of any person. Accordingly, no warranty whatsoever is given and no liability whatsoever is accepted for any loss arising whether directly or indirectly as a result of any person acting based on this information. You should seek advice from a financial adviser regarding the suitability of any investment product(s) mentioned herein, taking into account your specific investment objectives, financial situation or particular needs, before making a commitment to invest in such products. Opinions expressed in these commentaries are subject to change without notice. Investments are subject to investment risks including the possible loss of the principal amount invested. The value of units in any fund and the income from them may fall as well as rise. Past performance figures as well as any projection or forecast used in these commentaries are not necessarily indicative of future or likely performance. Phillip Securities Pte Ltd (PSPL), its directors, connected persons or employees may from time to time have an interest in the financial instruments mentioned in these commentaries. The information contained in these commentaries has been obtained from public sources which PSPL has no reason to believe are unreliable and any analysis, forecasts, projections, expectations and opinions (collectively the “Research”) contained in these commentaries are based on such information and are expressions of belief only. PSPL has not verified this information and no representation or warranty, express or implied, is made that such information or Research is accurate, complete or verified or should be relied upon as such. Any such information or Research contained in these commentaries are subject to change, and PSPL shall not have any responsibility to maintain the information or Research made available or to supply any corrections, updates or releases in connection therewith. In no event will PSPL be liable for any special, indirect, incidental or consequential damages which may be incurred from the use of the information or Research made available, even if it has been advised of the possibility of such damages. The companies and their employees mentioned in these commentaries cannot be held liable for any errors, inaccuracies and/or omissions howsoever caused. Any opinion or advice herein is made on a general basis and is subject to change without notice. The information provided in these commentaries may contain optimistic statements regarding future events or future financial performance of countries, markets or companies. You must make your own financial assessment of the relevance, accuracy and adequacy of the information provided in these commentaries. Views and any strategies described in these commentaries may not be suitable for all investors. Opinions expressed herein may differ from the opinions expressed by other units of PSPL or its connected persons and associates. Any reference to or discussion of investment products or commodities in these commentaries is purely for illustrative purposes only and must not be construed as a recommendation, an offer or solicitation for the subscription, purchase or sale of the investment products or commodities mentioned. This advertisement has not been reviewed by the Monetary Authority of Singapore.

Centurion Corporation Positioned for Fee Income Growth Despite Mixed Results
Company Overview Centurion Corporation Ltd operates purpose-built worker accommodation (PBWA) and purpose-built student accommodation (PBSA) across Singapore, Malaysia, the UK, and Australia. The company has recently spun off its real estate investment trust, CAREIT, positioning itself to benefit from scalable property management fee income. Financial Performance Highlights Centurion delivered mixed results in 2H25, with revenue exceeding expectations at 105% of full-year forecasts, reaching S$155.2 million. This strong revenue performance was primarily driven by the consolidation of the remaining 55% stake in the 6,290-bed Westlite Mandai facility, which represents 17% of Singapore's bed capacity. However, adjusted profit after tax and minority interests (PATMI) fell short of expectations at 91% of forecasts, impacted by a 33% year-on-year increase in administrative fees due to higher manpower costs. Key Positive Developments Singapore PBWA operations demonstrated robust growth, with 2H25 revenue increasing 24% year-on-year to S$113 million. Beyond the Westlite Mandai consolidation, positive rental revisions contributed to this growth. The newly operational 1,650-bed Westlite Ubi facility, featuring rental rates estimated to be 5-10% higher than existing properties, further supported Singapore revenue expansion. The company's balance sheet has strengthened significantly following CAREIT's spin-off, generating approximately S$473 million in net proceeds. Net debt decreased 38% year-on-year to S$332 million, whilst the net gearing ratio improved substantially to 27% from 46% in FY24. CAREIT's property management fees present a promising revenue stream, with Centurion recognising S$6.5 million in revenue and S$3.2 million in PATMI during 4Q25, achieving a healthy 49% profit margin. Analysts estimate CAREIT's revenue will grow 25% year-on-year in FY26, potentially generating approximately S$16 million in property management fees for Centurion. Challenges Australia PBSA operations faced headwinds, with revenue declining 7.6% year-on-year to S$9 million. Occupancy rates dropped to 93% from 96% in FY24, primarily due to student arrival delays caused by visa requirement changes. However, the Australian government's decision to raise the student visa cap by 9% to 295,000 in August 2025 suggests potential recovery ahead. Investment Outlook Phillip Securities Research maintains a BUY recommendation with an unchanged target price of S$1.81. The firm expects FY26 consolidated adjusted PATMI to decline approximately 14% year-on-year due to increased profit attributable to minority interests from CAREIT's inclusion. Centurion has proposed a special dividend-in-specie distribution of one CAREIT unit for every ten Centurion shares, estimated to yield shareholders approximately 7%. Frequently Asked Questions Q: What drove Centurion's strong revenue performance in 2H25? A: Revenue exceeded expectations primarily due to the consolidation of the remaining 55% stake in the 6,290-bed Westlite Mandai facility and positive rental revisions across the Singapore PBWA portfolio. Q: Why did adjusted PATMI fall below expectations despite strong revenue? A: Adjusted PATMI was impacted by a 33% year-on-year increase in administrative fees, excluding CAREIT IPO fees, primarily due to higher manpower costs. Q: How significant is the CAREIT property management fee income? A: In 4Q25, Centurion recognised S$6.5 million in revenue and S$3.2 million in PATMI from CAREIT property management fees, with a healthy 49% profit margin. This income stream is estimated to grow 25% year-on-year in FY26. Q: What challenges did the Australia PBSA segment face? A: Australia PBSA revenue declined 7.6% year-on-year due to occupancy dropping to 93% from 96%, caused by delays in student arrivals due to visa requirement changes. Q: How has Centurion's balance sheet improved? A: Following CAREIT's spin-off, net debt decreased 38% year-on-year to S$332 million, and the net gearing ratio improved to 27% from 46% in FY24, benefiting from approximately S$473 million in net proceeds. Q: What is Phillip Securities Research's recommendation? A: Phillip Securities Research maintains a BUY recommendation with an unchanged target price of S$1.81, before the dividend-in-specie distribution. Q: What special dividend is Centurion proposing? A: Centurion has proposed a special dividend-in-specie distribution of one CAREIT unit for every ten Centurion shares, estimated to yield shareholders approximately 7%. Q: What is the outlook for Australia PBSA operations? A: The Australian government raised the student visa cap by 9% to 295,000 in August 2025, which is expected to improve Australia PBSA occupancy in FY26 through increased international student demand. This article has been auto-generated using PhillipGPT. It is based on a report by a Phillip Securities Research analyst. Disclaimer These commentaries are intended for general circulation and do not have regard to the specific investment objectives, financial situation and particular needs of any person. Accordingly, no warranty whatsoever is given and no liability whatsoever is accepted for any loss arising whether directly or indirectly as a result of any person acting based on this information. You should seek advice from a financial adviser regarding the suitability of any investment product(s) mentioned herein, taking into account your specific investment objectives, financial situation or particular needs, before making a commitment to invest in such products. Opinions expressed in these commentaries are subject to change without notice. Investments are subject to investment risks including the possible loss of the principal amount invested. The value of units in any fund and the income from them may fall as well as rise. Past performance figures as well as any projection or forecast used in these commentaries are not necessarily indicative of future or likely performance. Phillip Securities Pte Ltd (PSPL), its directors, connected persons or employees may from time to time have an interest in the financial instruments mentioned in these commentaries. The information contained in these commentaries has been obtained from public sources which PSPL has no reason to believe are unreliable and any analysis, forecasts, projections, expectations and opinions (collectively the “Research”) contained in these commentaries are based on such information and are expressions of belief only. PSPL has not verified this information and no representation or warranty, express or implied, is made that such information or Research is accurate, complete or verified or should be relied upon as such. Any such information or Research contained in these commentaries are subject to change, and PSPL shall not have any responsibility to maintain the information or Research made available or to supply any corrections, updates or releases in connection therewith. In no event will PSPL be liable for any special, indirect, incidental or consequential damages which may be incurred from the use of the information or Research made available, even if it has been advised of the possibility of such damages. The companies and their employees mentioned in these commentaries cannot be held liable for any errors, inaccuracies and/or omissions howsoever caused. Any opinion or advice herein is made on a general basis and is subject to change without notice. The information provided in these commentaries may contain optimistic statements regarding future events or future financial performance of countries, markets or companies. You must make your own financial assessment of the relevance, accuracy and adequacy of the information provided in these commentaries. Views and any strategies described in these commentaries may not be suitable for all investors. Opinions expressed herein may differ from the opinions expressed by other units of PSPL or its connected persons and associates. Any reference to or discussion of investment products or commodities in these commentaries is purely for illustrative purposes only and must not be construed as a recommendation, an offer or solicitation for the subscription, purchase or sale of the investment products or commodities mentioned. This advertisement has not been reviewed by the Monetary Authority of Singapore.

17LIVE Group Limited Maintains BUY Rating Despite Revenue Decline
Company Overview 17LIVE Group Limited operates as a live-streaming platform company, focusing on interactive entertainment services that connect content creators with audiences through real-time streaming technology. The company generates revenue primarily through its live-streaming platform whilst exploring diversification opportunities to strengthen its market position. Financial Performance and Earnings Turnaround 17LIVE demonstrated resilience in its latest results, with 2H25 earnings showing a significant turnaround despite revenue challenges. Revenue declined 13.4% year-on-year to US$77.6 million, primarily attributed to foreign exchange headwinds and flat growth in the broader live-streaming market. However, the company achieved a notable profit improvement, with PATMI turning positive to US$3.7 million from a loss of US$5.2 million in 2H24. For the full financial year, FY25 revenue reached 91% of forecasts, though PATMI missed expectations with a net loss of US$0.9 million compared to the anticipated US$5.48 million profit forecast. Key Positives Driving Recovery The profit improvement reflects 17LIVE's successful cost optimisation initiatives implemented since 2024. These efforts targeted IT infrastructure, marketing expenses, and organisational efficiency, resulting in operating expenses declining by approximately 2.5% year-on-year to US$32.4 million from US$33.2 million. 17LIVE has enhanced shareholder value through its dividend policy, declaring a final dividend of 0.5 Singapore cents per share for 2H25, bringing the total FY2025 dividend to 2.0 Singapore cents per share. This distribution is supported by the company's robust cash position of US$73.4 million. Operating cash flow turned positive in FY25 to US$4.35 million, compared to negative US$16.7 million in FY24. The company continues executing its share buyback programme launched in 2024, with authority to repurchase up to 10% of issued share capital. As of 2H25, 9 million shares worth US$6.8 million have been repurchased, representing approximately 53% of the authorised limit. Strategic Outlook and Research Recommendation 17LIVE plans to monetise existing assets and diversify revenue streams through initiatives including V-Liver IP, sports collaborations, and short-form drama content, expected to gradually drive user engagement and revenue growth. Phillip Securities Research maintains its BUY rating whilst reducing the target price from S$1.45 to S$1.18, reflecting softer growth assumptions for the live-streaming market and slower monetisation trends. At current levels, 17LIVE trades at an FY26e P/E of 33x. Frequently Asked Questions Q: What was 17LIVE's revenue performance in 2H25? A: Revenue declined 13.4% year-on-year to US$77.6 million, mainly due to foreign exchange headwinds and flat growth in the live-streaming market. Q: How did the company's profitability change in 2H25? A: PATMI turned positive to US$3.7 million from a loss of US$5.2 million in 2H24, driven by ongoing cost-optimisation efforts. Q: What dividend is 17LIVE paying for FY2025? A: The company declared a total dividend of 2.0 Singapore cents per share for FY2025, including a final dividend of 0.5 Singapore cents per share for 2H25. Q: What is Phillip Securities Research's current recommendation? A: They maintain a BUY rating but reduced the target price from S$1.45 to S$1.18, with 17LIVE trading at an FY26e P/E of 33x. Q: How is 17LIVE planning to diversify its revenue streams? A: The company plans to monetise existing assets through initiatives including V-Liver IP, sports collaborations, and short-form drama content. Q: What is the company's cash position? A: 17LIVE maintains a strong cash position of US$73.4 million, with operating cash flow turning positive to US$4.35 million in FY25. Q: How much has the company spent on share buybacks? A: As of 2H25, 9 million shares worth US$6.8 million have been repurchased, representing approximately 53% of the authorised limit under the current mandate. This article has been auto-generated using PhillipGPT. It is based on a report by a Phillip Securities Research analyst. Disclaimer These commentaries are intended for general circulation and do not have regard to the specific investment objectives, financial situation and particular needs of any person. Accordingly, no warranty whatsoever is given and no liability whatsoever is accepted for any loss arising whether directly or indirectly as a result of any person acting based on this information. You should seek advice from a financial adviser regarding the suitability of any investment product(s) mentioned herein, taking into account your specific investment objectives, financial situation or particular needs, before making a commitment to invest in such products. Opinions expressed in these commentaries are subject to change without notice. Investments are subject to investment risks including the possible loss of the principal amount invested. The value of units in any fund and the income from them may fall as well as rise. Past performance figures as well as any projection or forecast used in these commentaries are not necessarily indicative of future or likely performance. Phillip Securities Pte Ltd (PSPL), its directors, connected persons or employees may from time to time have an interest in the financial instruments mentioned in these commentaries. The information contained in these commentaries has been obtained from public sources which PSPL has no reason to believe are unreliable and any analysis, forecasts, projections, expectations and opinions (collectively the “Research”) contained in these commentaries are based on such information and are expressions of belief only. PSPL has not verified this information and no representation or warranty, express or implied, is made that such information or Research is accurate, complete or verified or should be relied upon as such. Any such information or Research contained in these commentaries are subject to change, and PSPL shall not have any responsibility to maintain the information or Research made available or to supply any corrections, updates or releases in connection therewith. In no event will PSPL be liable for any special, indirect, incidental or consequential damages which may be incurred from the use of the information or Research made available, even if it has been advised of the possibility of such damages. The companies and their employees mentioned in these commentaries cannot be held liable for any errors, inaccuracies and/or omissions howsoever caused. Any opinion or advice herein is made on a general basis and is subject to change without notice. The information provided in these commentaries may contain optimistic statements regarding future events or future financial performance of countries, markets or companies. You must make your own financial assessment of the relevance, accuracy and adequacy of the information provided in these commentaries. Views and any strategies described in these commentaries may not be suitable for all investors. Opinions expressed herein may differ from the opinions expressed by other units of PSPL or its connected persons and associates. Any reference to or discussion of investment products or commodities in these commentaries is purely for illustrative purposes only and must not be construed as a recommendation, an offer or solicitation for the subscription, purchase or sale of the investment products or commodities mentioned. This advertisement has not been reviewed by the Monetary Authority of Singapore.


