
Price-to-earnings (P/E) ratio
Table of Contents
Price-to-earnings (P/E) ratio
Investors evaluate companies from various angles in their search for reliable stocks. The viewpoints can be strengthened by using different analysis. One technique that can assist you in determining a stock’s fair market value is fundamental analysis.
Fundamental analysis forms the foundation for numerous ratios. The price-to-earnings ratio (P/E ratio) is an important measure that investors use to evaluate a company from a valuation standpoint.
What is price-to-earnings (P/E) ratio?
Price-to-earnings (P/E) ratio, sometimes referred to as the earnings multiple, is a method for valuing businesses that helps investors determine whether a firm is overvalued or undervalued.
Financial indicators that examine a firm’s earnings, such as P/E ratios, are crucial because they help investors and investment bankers make judgments and reveal whether a company is or will be profitable.
Using the price-to-earnings ratio, one can assess how a company stacks up against rivals in the same sector. P/E ratios of various firms can be compared to determine a better investment.
To better understand a company’s growth and potential future growth, the P/E ratio can also be compared to the company’s historical performance.
Understanding the price-to-earnings (P/E) ratio
The price-to-earnings Ratio (P/E) is one of the measures that analysts and investors use most frequently to determine a stock’s relative value. You can decide if a stock is overvalued or undervalued using its P/E ratio. A company’s P/E ratio can also be contrasted with other stocks in the same industry or the market, such as the S&P 500 Index.
The P/E 10 or P/E 30 metrics, which average the last 10 or prior 30 years of earnings, are occasionally considered by analysts interested in long-term valuation patterns. When calculating the total worth of stock indices like the S&P 500, these longer-term metrics are typically used since they can take the business cycle into account.
P/E ratio formula and calculation
The key equation for determining a company’s trailing P/E ratio is:
P/E ratio = cost per share/earnings per share
This formula reads:
The stock’s current market price is the cost per share, or the price associated with purchasing one share of a corporation.
Earnings per share (EPS) is the annual net profit divided by the number of outstanding shares for a corporation (shares of common stock issued to investors). A future P/E analysis considers expected earnings from analysts and the company itself, whereas a trailing P/E analysis bases the earnings per share on the last 12 months of earnings.
The P/E ratio of a corporation is usually shown in the form of an “x” (such as 20x or 15x), which denotes how often the stock price is greater than the earnings per share. A company’s P/E ratio is 30/1 or 30x if its stock trades at $30 per share and earns $1 per share annually.
All that reveals is that the corporation makes $1 annually for every $30 in stock. Or, it would take 30 years for the company to make enough money to reimburse the share price assuming the stock price and earnings remained unchanged.
Types of price-to-earnings (P/E) ratio
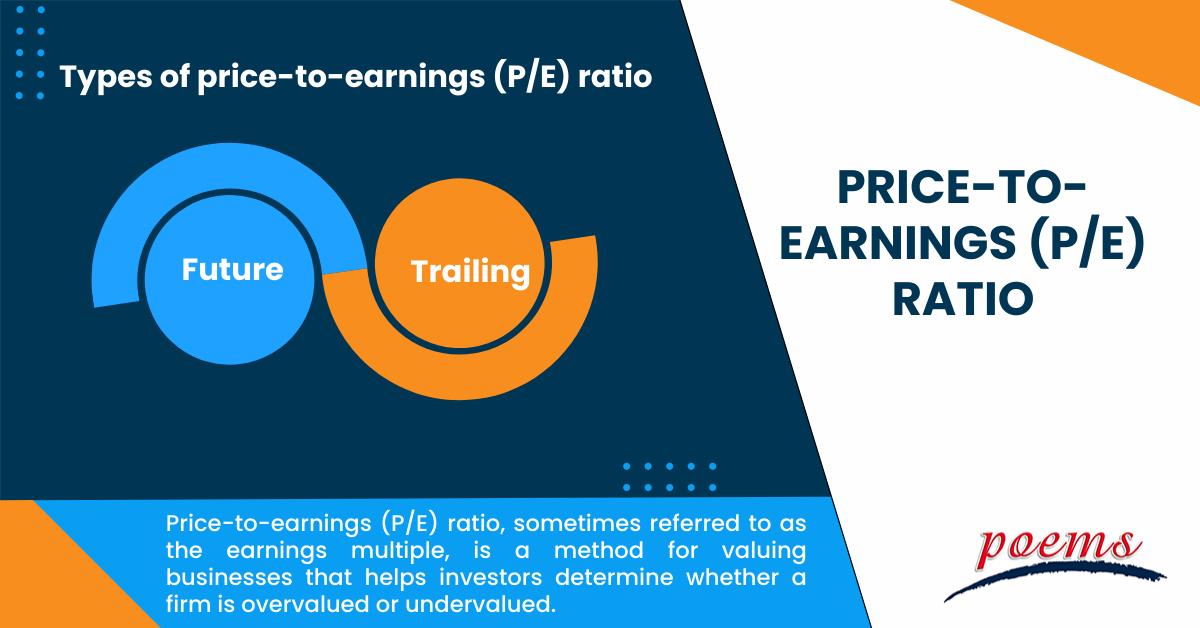
The types of price-to-earnings (P/E) ratios are as follows:
- Future P/E ratio
It is computed by dividing the prices of a company’s shares of stock by the company’s projected earnings as indicated by its forward-looking earnings projection. This type of ratio is also known as an estimated P/E Ratio because it is based on a company’s expected future earnings.
- Trailing P/E ratio
Investors commonly use the trailing P/E Ratio, which looks at a company’s historical earnings over a given period. This offers a more precise and impartial picture of a company’s performance.
Example of price-to-earnings (P/E) ratio
To better understand the price-to-earnings (P/E) ratio, let’s look at the following example:
If Stock X is trading at $30 and Stock Y is at $20, Stock X is not necessarily more costly. From a value perspective, the P/E ratio might help us choose which of the two is less expensive.
Even though Stock X has a greater absolute price than Stock Y, if the sector’s average P/E is 15, Stock X is more affordable since you pay less for every $1 in current earnings. However, Stock Y has a larger ratio than its rival and the industry. This could imply that investors anticipate future earnings growth higher than the market average.
Frequently Asked Questions
The P/E ratios opposite is the earnings yield. The P/E ratio shows the investor how long it would take for the firm to maintain its earnings to reach the current share price, whereas the earnings yield informs a shareholder how much he has earned per share held.
Price-to-earnings growth (PEG) and price-to-earnings (PE) ratios are fairly comparable. The company’s stock price about its earnings-per-share can be understood using both ratios (EPS). The PEG ratio includes the anticipated growth rate in earnings, which is the only distinction between the two measures.
High P/E ratios on stocks may indicate that investors anticipate future profit growth to be higher. Stocks with low P/E ratios are tempting to value investors because they suggest they pay less for each dollar of earnings they receive, in contrast to stocks with high P/E ratios, which are attractive to growth investors.
The P/E ratio’s major drawback is that it gives investors little information about the likelihood of the company’s EPS growing. If a firm expands swiftly, you will feel confident purchasing it even if its P/E ratio is high because you know that EPS growth will drive the P/E back down to a more reasonable level.
If the P/E ratio is negative, the company is either losing money or reporting negative earnings. Even the most well-established companies occasionally experience downtime, which can be brought on by factors outside the company’s control.
Related Terms
- Investment adviser public disclosure
- Price-to-Book Ratio
- Investment adviser registration depository
- Contingent deferred sales charges
- Net asset value (NAV)
- CAGR
- Mark-to-market
- Federal Open Market Committee
- FIRE
- Applicable federal rate
- Automated teller machine
- Central limit theorem
- Balanced scorecard
- Analysis of variance
- Annual Percentage rate
- Double Taxation Agreement
- Floating Rate Notes
- Average True Range (ATR)
- Constant maturity treasury
- Employee stock option
- Hysteresis
- RevPAR
- REITS
- General and administrative expenses
- OPEX
- ARPU
- WACC
- DCF
- NPL
- Capital expenditure (Capex)
- Balance of trade (BOT)
- Retail price index (RPI)
- Unit investment trust (UIT)
- SPAC
- GAAP
- GDPR
- GATT
- Irrevocable Trust
- Line of credit
- Coefficient of Variation (CV)
- Creative Destruction (CD)
- Letter of credits (LC)
- Statement of additional information
- Year to date
- Certificate of deposit
- Individual retirement account (IRA)
- Quantitative easing
- Yield to maturity
- Rights of accumulation (ROA)
- Letter of Intent
- Return on Invested Capital (ROIC)
- Return on Equity (ROE)
- Return on Assets (ROA)
Most Popular Terms
Other Terms
- Bond Convexity
- Compound Yield
- Brokerage Account
- Discretionary Accounts
- Industry Groups
- Growth Rate
- Green Bond Principles
- Gamma Scalping
- Funding Ratio
- Free-Float Methodology
- Foreign Direct Investment (FDI)
- Floating Dividend Rate
- Flight to Quality
- Real Return
- Protective Put
- Perpetual Bond
- Option Adjusted Spread (OAS)
- Non-Diversifiable Risk
- Merger Arbitrage
- Liability-Driven Investment (LDI)
- Income Bonds
- Guaranteed Investment Contract (GIC)
- Flash Crash
- Equity Carve-Outs
- Cost of Equity
- Cost Basis
- Deferred Annuity
- Cash-on-Cash Return
- Earning Surprise
- Capital Adequacy Ratio (CAR)
- Bubble
- Beta Risk
- Bear Spread
- Asset Play
- Accrued Market Discount
- Ladder Strategy
- Junk Status
- Intrinsic Value of Stock
- Interest-Only Bonds (IO)
- Interest Coverage Ratio
- Inflation Hedge
- Industry Groups
- Incremental Yield
- Industrial Bonds
- Income Statement
- Holding Period Return
- Historical Volatility (HV)
- Hedge Effectiveness
- Flat Yield Curve
- Fallen Angel
Know More about
Tools/Educational Resources
Markets Offered by POEMS
Read the Latest Market Journal

Q&M Dental Group Poised for Major Expansion Through Strategic Acquisitions
Company Overview Q&M Dental Group Ltd operates as a dental services provider with a current network of more than 150 standalone clinics in Singapore and Malaysia. The company is positioning itself to become a major dental franchise platform through strategic acquisitions and organic growth initiatives. Ambitious Acquisition Strategy The company has announced three significant proposed acquisitions totalling approximately S$272 million, which could potentially double its earnings upon completion. These acquisitions span across Australia, Singapore, and Thailand, backed by robust profit guarantees totalling S$200 million over five to eight years. The largest acquisition involves an Australian dental network valued at A$144.5 million (approximately S$130 million), comprising more than 40 clinics and 120 dentists. This will be complemented by additional Singapore clinic acquisitions and a Thai operation focused on cosmetic and aesthetic dentistry with over 30 clinics. Financing Structure and Growth Projections The acquisitions will be financed through a combination of cash and shares, following the Australian acquisition template where 40% of the purchase consideration will be satisfied through shares issued at S$0.70. Notably, the structure includes a 15-year moratorium on shares and service agreements to ensure vendor alignment with long-term objectives. The profit guarantees provide embedded earnings growth of approximately 14% per annum over the next three years. These acquisitions are expected to boost FY26 estimated earnings per share by 80% to 3.5 cents. Operational Synergies and Network Expansion The expanded network will create opportunities for revenue and cost synergies, alongside the implementation of best practices in marketing, advanced dentistry, and operations. The company aims to aggressively grow the Australian network towards 400 clinics over five years, whilst targeting 300 dental clinics across Singapore over the same period. The broader network will also serve as a platform for rolling out EM2AI solutions. Financial Performance and Outlook FY25 revenue exceeded expectations at 105% with the consolidation of Aoxin Q&M, though net profit came in at 68% due to S$2.4 million in interest expenses and S$2 million in one-off costs. Additional government subsidies for restorative dental procedures introduced in October contributed a 3% boost to Singapore revenue in the second half of FY25. Phillip Securities Research Recommendation Phillip Securities Research maintains a BUY recommendation with a raised target price of S$0.71 (previously S$0.545). The fair value post-acquisition is estimated at S$0.95, though a 50% discount has been applied pending completion of the acquisitions. The valuation is pegged at 25x PE FY26, in line with the Singapore healthcare sector. Frequently Asked Questions Q: What is the total value of Q&M Dental's proposed acquisitions? A: The three proposed acquisitions have an estimated total value of S$272 million, covering dental operations in Australia, Singapore, and Thailand. Q: How will these acquisitions be financed? A: The acquisitions will be satisfied through a combination of cash and shares, with 40% of the purchase consideration in shares issued at S$0.70, following the Australian acquisition template. Q: What are the profit guarantees associated with these acquisitions? A: The acquisitions are backed by profit guarantees totalling S$200 million over five to eight years, providing embedded earnings growth of approximately 14% per annum for the next three years. Q: What is Phillip Securities Research's recommendation and target price? A: Phillip Securities Research maintains a BUY recommendation with a raised target price of S$0.71, up from the previous target of S$0.545. Q: How many clinics does Q&M currently operate and what are its expansion plans? A: Q&M currently operates more than 150 clinics in Singapore and Malaysia and aims to grow towards 300 dental clinics in Singapore and 400 clinics in Australia over the next five years. Q: What impact will the acquisitions have on earnings? A: The acquisitions are estimated to boost FY26 earnings per share by 80% to 3.5 cents, with the potential to double the company's overall earnings upon completion. Q: What operational benefits are expected from the acquisitions? A: The expanded network will create opportunities for revenue and cost synergies, implementation of best practices in marketing and operations, and serve as a platform for rolling out EM2AI solutions across the broader clinic network. This article has been auto-generated using PhillipGPT. It is based on a report by a Phillip Securities Research analyst. Disclaimer These commentaries are intended for general circulation and do not have regard to the specific investment objectives, financial situation and particular needs of any person. Accordingly, no warranty whatsoever is given and no liability whatsoever is accepted for any loss arising whether directly or indirectly as a result of any person acting based on this information. You should seek advice from a financial adviser regarding the suitability of any investment product(s) mentioned herein, taking into account your specific investment objectives, financial situation or particular needs, before making a commitment to invest in such products. Opinions expressed in these commentaries are subject to change without notice. Investments are subject to investment risks including the possible loss of the principal amount invested. The value of units in any fund and the income from them may fall as well as rise. Past performance figures as well as any projection or forecast used in these commentaries are not necessarily indicative of future or likely performance. Phillip Securities Pte Ltd (PSPL), its directors, connected persons or employees may from time to time have an interest in the financial instruments mentioned in these commentaries. The information contained in these commentaries has been obtained from public sources which PSPL has no reason to believe are unreliable and any analysis, forecasts, projections, expectations and opinions (collectively the “Research”) contained in these commentaries are based on such information and are expressions of belief only. PSPL has not verified this information and no representation or warranty, express or implied, is made that such information or Research is accurate, complete or verified or should be relied upon as such. Any such information or Research contained in these commentaries are subject to change, and PSPL shall not have any responsibility to maintain the information or Research made available or to supply any corrections, updates or releases in connection therewith. In no event will PSPL be liable for any special, indirect, incidental or consequential damages which may be incurred from the use of the information or Research made available, even if it has been advised of the possibility of such damages. The companies and their employees mentioned in these commentaries cannot be held liable for any errors, inaccuracies and/or omissions howsoever caused. Any opinion or advice herein is made on a general basis and is subject to change without notice. The information provided in these commentaries may contain optimistic statements regarding future events or future financial performance of countries, markets or companies. You must make your own financial assessment of the relevance, accuracy and adequacy of the information provided in these commentaries. Views and any strategies described in these commentaries may not be suitable for all investors. Opinions expressed herein may differ from the opinions expressed by other units of PSPL or its connected persons and associates. Any reference to or discussion of investment products or commodities in these commentaries is purely for illustrative purposes only and must not be construed as a recommendation, an offer or solicitation for the subscription, purchase or sale of the investment products or commodities mentioned. This advertisement has not been reviewed by the Monetary Authority of Singapore.

Micron Technology Reports Record Quarterly Performance Amid Strategic Shifts
Company Overview Micron Technology, Inc is a leading global semiconductor company specialising in memory and storage solutions, including DRAM and NAND flash memory products that are essential components in various electronic devices and data centres. Strong Financial Performance Drives Optimism Micron Technology has delivered exceptional financial results for the second quarter of fiscal year 2026, with adjusted profit after tax and minority interests (PATMI) surging 686% year-on-year to a record US$14 billion. This remarkable performance was driven by substantial bit shipment growth of approximately 35% year-on-year, combined with significant increases in average selling prices (ASPs) for both DRAM and NAND memory products, which rose an estimated 107% and 118% respectively. The company's revenue performance aligned with analyst expectations, with first-half fiscal 2026 revenue representing 50% of the full-year forecast. Meanwhile, the adjusted PATMI exceeded expectations, accounting for 58% of the annual projection, indicating strong momentum in the business. Strategic Customer Agreements Signal Market Evolution A significant development for Micron has been the establishment of its first five-year strategic customer agreement (SCA) with an undisclosed large customer. This represents a notable shift from the company's traditional approach of securing long-term agreements that typically last only one year. The move reflects the evolving landscape in the semiconductor industry, where high-end chipmakers and hyperscalers increasingly view memory as strategically critical in the artificial intelligence race, leading to longer-term contractual commitments across the sector. Market Outlook and Geopolitical Considerations Phillip Securities Research maintains a BUY recommendation with an upgraded target price of US$530, increased from the previous US$500. The research house has raised its fiscal 2026 revenue and PATMI forecasts by 43% and 100% respectively, citing an ongoing industry shortage in memory chips that is expected to continue pushing DRAM and NAND ASPs higher. However, the analysis incorporates geopolitical risk factors, particularly concerns about potential disruptions from Middle East conflicts. The research notes that closure of the Straits of Hormuz could threaten 30% of global helium supply, a critical component in semiconductor wafer manufacturing. Micron is considered better positioned than Korean competitors due to its stronger presence in the United States, which accounts for approximately 45% of global helium production compared to Qatar's 30%. Frequently Asked Questions Q: What drove Micron's record quarterly performance? A: The record US$14 billion adjusted PATMI was driven by bit shipment growth of approximately 35% year-on-year and significant increases in DRAM and NAND average selling prices, which rose an estimated 107% and 118% respectively. Q: How significant is Micron's new strategic customer agreement? A: This is Micron's first five-year strategic customer agreement, representing a major shift from traditional long-term agreements that typically last only one year, reflecting the strategic importance of memory in the AI race. Q: What is Phillip Securities Research's recommendation and target price? A: Phillip Securities Research maintains a BUY recommendation with a target price of US$530, upgraded from the previous US$500. Q: How much did analysts raise their forecasts? A: Phillip Securities Research’s analysts raised fiscal 2026 revenue forecasts by 43% and PATMI forecasts by 100%. Q: What supply outlook does the research anticipate? A: Industry supply is expected to increase meaningfully starting from the second half of calendar year 2027, as SK Hynix aims to maintain its 2026 capital expenditure-to-sales ratio at approximately mid-30% level. Q: What geopolitical risks affect Micron? A: Potential closure of the Straits of Hormuz could threaten 30% of global helium supply, critical for semiconductor manufacturing, though Micron is considered better positioned than Korean competitors due to stronger US presence. Q: How does Micron's geographic positioning help with supply chain risks? A: Micron benefits from stronger presence in the United States, which accounts for about 45% of global helium production compared to Qatar's 30%, providing better insulation from Middle East conflicts than Korean competitors. This article has been auto-generated using PhillipGPT. It is based on a report by a Phillip Securities Research analyst. Disclaimer These commentaries are intended for general circulation and do not have regard to the specific investment objectives, financial situation and particular needs of any person. Accordingly, no warranty whatsoever is given and no liability whatsoever is accepted for any loss arising whether directly or indirectly as a result of any person acting based on this information. You should seek advice from a financial adviser regarding the suitability of any investment product(s) mentioned herein, taking into account your specific investment objectives, financial situation or particular needs, before making a commitment to invest in such products. Opinions expressed in these commentaries are subject to change without notice. Investments are subject to investment risks including the possible loss of the principal amount invested. The value of units in any fund and the income from them may fall as well as rise. Past performance figures as well as any projection or forecast used in these commentaries are not necessarily indicative of future or likely performance. Phillip Securities Pte Ltd (PSPL), its directors, connected persons or employees may from time to time have an interest in the financial instruments mentioned in these commentaries. The information contained in these commentaries has been obtained from public sources which PSPL has no reason to believe are unreliable and any analysis, forecasts, projections, expectations and opinions (collectively the “Research”) contained in these commentaries are based on such information and are expressions of belief only. PSPL has not verified this information and no representation or warranty, express or implied, is made that such information or Research is accurate, complete or verified or should be relied upon as such. Any such information or Research contained in these commentaries are subject to change, and PSPL shall not have any responsibility to maintain the information or Research made available or to supply any corrections, updates or releases in connection therewith. In no event will PSPL be liable for any special, indirect, incidental or consequential damages which may be incurred from the use of the information or Research made available, even if it has been advised of the possibility of such damages. The companies and their employees mentioned in these commentaries cannot be held liable for any errors, inaccuracies and/or omissions howsoever caused. Any opinion or advice herein is made on a general basis and is subject to change without notice. The information provided in these commentaries may contain optimistic statements regarding future events or future financial performance of countries, markets or companies. You must make your own financial assessment of the relevance, accuracy and adequacy of the information provided in these commentaries. Views and any strategies described in these commentaries may not be suitable for all investors. Opinions expressed herein may differ from the opinions expressed by other units of PSPL or its connected persons and associates. Any reference to or discussion of investment products or commodities in these commentaries is purely for illustrative purposes only and must not be construed as a recommendation, an offer or solicitation for the subscription, purchase or sale of the investment products or commodities mentioned. This advertisement has not been reviewed by the Monetary Authority of Singapore.

Singapore REITs Show Resilience Despite February Decline
Market Performance and Sector Overview Singapore Real Estate Investment Trusts (S-REITs) experienced a modest setback in February 2026, with the S-REITs Index declining 1.9% after posting a 0.7% gain in January. This correction reflects broader market volatility amid ongoing geopolitical tensions and monetary policy uncertainty. The S-REITs sector encompasses a diverse portfolio of real estate investments, including retail properties in Singapore and commercial assets overseas. These investment vehicles provide investors with exposure to income-generating real estate across multiple geographic markets and property types, offering regular dividend distributions and portfolio diversification benefits. Individual REIT Performance Performance varied significantly across individual REITs during February. Stoneweg Europe Stapled Trust emerged as the standout performer, surging 6.9% following strong full-year 2025 results. Conversely, Prime US REIT faced headwinds, declining 12.9% after the previous month's 14.2% rally, as investors reassessed the pace of occupancy recovery within its portfolio. Sub-sector performance also diverged notably. Singapore retail REITs led gains with a 0.8% increase, demonstrating the resilience of domestic retail properties. However, overseas commercial properties struggled, particularly US office S-REITs, which contributed to an 8% decline in the overseas commercial sub-sector. Interest Rate Environment and Growth Prospects Despite inflationary pressures stemming from Middle East geopolitical tensions and Federal Reserve expectations of maintaining elevated interest rates, analysts identify potential catalysts for stronger distribution per unit growth in financial year 2026. The continued decline in benchmark Singapore Overnight Rate Average rates is expected to generate meaningful interest cost savings for S-REITs, supporting improved financial performance. Investment Outlook and Recommendations Phillip Securities Research maintains an OVERWEIGHT recommendation on S-REITs, citing their stable performance and defensive characteristics as attractive features for global investors navigating market uncertainty. The sector's valuation metrics remain compelling, trading at a forward dividend yield spread of approximately 3.8% and a price-to-net asset value ratio of 0.97 times. Within sub-sectors, retail properties are favoured due to expectations of strong rental reversions in the high single digits throughout 2026. Overseas S-REITs offering yields exceeding 8% with resilient portfolios are also preferred, including specific recommendations for Stoneweg Europe Stapled Trust with a target price of €1.89, Elite UK REIT at £0.41, United Hampshire US REIT at US$0.69, and Prime US REIT at US$0.32. Frequently Asked Questions Q: What was the performance of Singapore REITs in February 2026? A: The S-REITs Index fell 1.9% in February 2026, reversing the 0.7% gain recorded in January 2026. Q: Which REIT was the best performer in February and why? A: Stoneweg Europe Stapled Trust was the top performer, rising 6.9% on strong FY25 results. Q: What is Phillip Securities Research's overall recommendation on S-REITs? A: Phillip Securities Research maintains an OVERWEIGHT recommendation on S-REITs due to their stable performance and defensive positioning. Q: Which sub-sectors are preferred and why? A: Retail is preferred due to expected strong rental reversions in the high single digits in 2026, and overseas S-REITs offering high yields over 8% with resilient portfolios are also favoured. Q: What are the key target prices mentioned in the report? A: Target prices include Stoneweg Europe Stapled Trust at €1.89, Elite UK REIT at £0.41, United Hampshire US REIT at US$0.69, and Prime US REIT at US$0.32. Q: What factors support potential DPU growth in FY26? A: Interest cost savings from declining benchmark SORA rates are expected to support stronger distribution per unit growth in FY26. Q: How are S-REITs currently valued? A: The sector trades at a forward dividend yield spread of approximately 3.8% and a price-to-net asset value ratio of 0.97 times, which are considered undemanding valuations. Q: What challenges does the sector face? A: The sector faces inflation concerns from heightened geopolitical tensions in the Middle East and expectations that the Federal Reserve will maintain higher-for-longer interest rates. This article has been auto-generated using PhillipGPT. It is based on a report by a Phillip Securities Research analyst. Disclaimer These commentaries are intended for general circulation and do not have regard to the specific investment objectives, financial situation and particular needs of any person. Accordingly, no warranty whatsoever is given and no liability whatsoever is accepted for any loss arising whether directly or indirectly as a result of any person acting based on this information. You should seek advice from a financial adviser regarding the suitability of any investment product(s) mentioned herein, taking into account your specific investment objectives, financial situation or particular needs, before making a commitment to invest in such products. Opinions expressed in these commentaries are subject to change without notice. Investments are subject to investment risks including the possible loss of the principal amount invested. The value of units in any fund and the income from them may fall as well as rise. Past performance figures as well as any projection or forecast used in these commentaries are not necessarily indicative of future or likely performance. Phillip Securities Pte Ltd (PSPL), its directors, connected persons or employees may from time to time have an interest in the financial instruments mentioned in these commentaries. The information contained in these commentaries has been obtained from public sources which PSPL has no reason to believe are unreliable and any analysis, forecasts, projections, expectations and opinions (collectively the “Research”) contained in these commentaries are based on such information and are expressions of belief only. PSPL has not verified this information and no representation or warranty, express or implied, is made that such information or Research is accurate, complete or verified or should be relied upon as such. Any such information or Research contained in these commentaries are subject to change, and PSPL shall not have any responsibility to maintain the information or Research made available or to supply any corrections, updates or releases in connection therewith. In no event will PSPL be liable for any special, indirect, incidental or consequential damages which may be incurred from the use of the information or Research made available, even if it has been advised of the possibility of such damages. The companies and their employees mentioned in these commentaries cannot be held liable for any errors, inaccuracies and/or omissions howsoever caused. Any opinion or advice herein is made on a general basis and is subject to change without notice. The information provided in these commentaries may contain optimistic statements regarding future events or future financial performance of countries, markets or companies. You must make your own financial assessment of the relevance, accuracy and adequacy of the information provided in these commentaries. Views and any strategies described in these commentaries may not be suitable for all investors. Opinions expressed herein may differ from the opinions expressed by other units of PSPL or its connected persons and associates. Any reference to or discussion of investment products or commodities in these commentaries is purely for illustrative purposes only and must not be construed as a recommendation, an offer or solicitation for the subscription, purchase or sale of the investment products or commodities mentioned. This advertisement has not been reviewed by the Monetary Authority of Singapore.

Wee Hur Holdings Upgraded to Buy on Strong Performance and Growth Prospects
Company Overview Wee Hur Holdings Ltd is a Singapore-based company operating across three key business segments: worker dormitory operations, building construction, and property development. The company has established itself as a significant player in Singapore's infrastructure and accommodation sectors, with substantial dormitory assets and a growing construction order book. Strong Financial Performance Drives Upgrade Phillip Securities Research has upgraded Wee Hur Holdings to BUY from NEUTRAL, raising the target price to S$1.08 from S$0.90 previously. This upgrade follows exceptional 2H25 results that significantly exceeded expectations, with revenue and adjusted PATMI reaching 114% and 138% of full-year forecasts respectively. The company's adjusted PATMI surged 81% year-on-year to S$50 million in 2H25, driven by multiple growth catalysts across its business segments. The strong performance reflects successful execution of the company's diversified business model and strategic positioning in Singapore's infrastructure development. Worker Dormitory Business Anchors Growth The worker dormitory segment delivered robust performance, with Tuas View Dormitory achieving 95% occupancy compared to 93% in FY24, alongside positive rental revisions of approximately 5% year-on-year. The segment benefited significantly from Pioneer Lodge's Phase 1 operations, which added 3,088 beds representing a 20% capacity increase since May 2025. This expansion drove dormitory revenue up 21% year-on-year to S$50.8 million in 2H25. Pioneer Lodge's Phase 2, comprising 7,412 beds and representing a 39% capacity increase, received its temporary occupancy permit in 4Q25 and is expected to contribute to occupancy ramp-up in FY26. Construction Segment Shows Marked Improvement The building construction segment demonstrated remarkable turnaround, with revenue spiking 172% year-on-year to S$50 million in 2H25. Operating margins improved substantially by 10 percentage points year-on-year to -7% in FY25, compared to -17% in FY24. This improvement was driven by higher recognition of external projects, which now comprise 99% of the company's S$673 million order book, up from 59% previously. The expanded order book, growing from S$263 million in FY24, is expected to support construction segment growth through 4Q29. Strategic Portfolio Adjustments The research firm's sum-of-the-parts valuation model reflects strategic portfolio changes, including the removal of Mega@Woodlands property development and the addition of Wee Hur's 50% stake in the S$614 million Upper Thomson Road GLS site. The model also incorporates the company's estimated 20% stake in the 344-key DoubleTree by Hilton hotel and Fund III, backed by a 708-bed Australia PBSA. Future Outlook With major construction projects including Changi Airport Terminal 5 and Marina Bay Sands Integrated Resort on the horizon, analysts expect Wee Hur's 15,744-bed Tuas View Dormitory lease to be extended beyond November 2026, providing continued revenue visibility for the dormitory business. Frequently Asked Questions Q: What is Phillip Securities Research's current recommendation and target price for Wee Hur Holdings? A: Phillip Securities Research has upgraded Wee Hur Holdings to BUY from NEUTRAL, with a higher target price of S$1.08, increased from the previous target of S$0.90. Q: How did Wee Hur's 2H25 results compare to expectations? A: The company's 2H25 revenue and adjusted PATMI significantly exceeded expectations, reaching 114% and 138% of full-year forecasts respectively, with adjusted PATMI surging 81% year-on-year to S$50 million. Q: What drove the strong performance in the worker dormitory segment? A: The dormitory segment benefited from Tuas View Dormitory's improved occupancy rate of 95% and positive rental revisions of about 5% year-on-year, plus contributions from Pioneer Lodge Phase 1's additional 3,088 beds, driving dormitory revenue up 21% year-on-year to S$50.8 million. Q: How has the building construction segment's profitability changed? A: The building construction segment's operating margins improved significantly by 10 percentage points year-on-year to -7% in FY25, compared to -17% in FY24, driven by higher recognition of external projects and an expanded order book. Q: What is the current size and composition of Wee Hur's construction order book? A: The company's construction order book stands at S$673 million, up from S$263 million in FY24, with external projects now comprising 99% of the order book compared to 59% previously. This order book is expected to support growth through 4Q29. Q: When will Pioneer Lodge Phase 2 contribute to operations? A: Pioneer Lodge Phase 2, comprising 7,412 beds and representing a 39% capacity increase, received its temporary occupancy permit in 4Q25 and is expected to ramp up occupancy in FY26. Q: What major construction projects could benefit Wee Hur's dormitory business? A: Major upcoming construction projects including Changi Airport Terminal 5 and Marina Bay Sands Integrated Resort are expected to support the extension of Wee Hur's 15,744-bed Tuas View Dormitory lease beyond November 2026. Q: What changes were made to the valuation model? A: The sum-of-the-parts model removed Mega@Woodlands property development and included Wee Hur's 50% stake in the S$614 million Upper Thomson Road GLS site, plus the company's estimated 20% stake in the 344-key DoubleTree by Hilton hotel and Fund III backed by a 708-bed Australia PBSA. This article has been auto-generated using PhillipGPT. It is based on a report by a Phillip Securities Research analyst. Disclaimer These commentaries are intended for general circulation and do not have regard to the specific investment objectives, financial situation and particular needs of any person. Accordingly, no warranty whatsoever is given and no liability whatsoever is accepted for any loss arising whether directly or indirectly as a result of any person acting based on this information. You should seek advice from a financial adviser regarding the suitability of any investment product(s) mentioned herein, taking into account your specific investment objectives, financial situation or particular needs, before making a commitment to invest in such products. Opinions expressed in these commentaries are subject to change without notice. Investments are subject to investment risks including the possible loss of the principal amount invested. The value of units in any fund and the income from them may fall as well as rise. Past performance figures as well as any projection or forecast used in these commentaries are not necessarily indicative of future or likely performance. Phillip Securities Pte Ltd (PSPL), its directors, connected persons or employees may from time to time have an interest in the financial instruments mentioned in these commentaries. The information contained in these commentaries has been obtained from public sources which PSPL has no reason to believe are unreliable and any analysis, forecasts, projections, expectations and opinions (collectively the “Research”) contained in these commentaries are based on such information and are expressions of belief only. PSPL has not verified this information and no representation or warranty, express or implied, is made that such information or Research is accurate, complete or verified or should be relied upon as such. Any such information or Research contained in these commentaries are subject to change, and PSPL shall not have any responsibility to maintain the information or Research made available or to supply any corrections, updates or releases in connection therewith. In no event will PSPL be liable for any special, indirect, incidental or consequential damages which may be incurred from the use of the information or Research made available, even if it has been advised of the possibility of such damages. The companies and their employees mentioned in these commentaries cannot be held liable for any errors, inaccuracies and/or omissions howsoever caused. Any opinion or advice herein is made on a general basis and is subject to change without notice. The information provided in these commentaries may contain optimistic statements regarding future events or future financial performance of countries, markets or companies. You must make your own financial assessment of the relevance, accuracy and adequacy of the information provided in these commentaries. Views and any strategies described in these commentaries may not be suitable for all investors. Opinions expressed herein may differ from the opinions expressed by other units of PSPL or its connected persons and associates. Any reference to or discussion of investment products or commodities in these commentaries is purely for illustrative purposes only and must not be construed as a recommendation, an offer or solicitation for the subscription, purchase or sale of the investment products or commodities mentioned. This advertisement has not been reviewed by the Monetary Authority of Singapore.

TeleChoice International Ltd Maintains Growth Trajectory with Strong FY25 Performance
Company Overview TeleChoice International Ltd is a telecommunications services provider focused on personal communications systems (PCS) and network engineering services. The company operates across Southeast Asia, with significant exposure to Malaysia's telecommunications market through its partnership with U-Mobile. Financial Performance Exceeds Expectations TeleChoice delivered FY25 results that met analyst forecasts, with revenue and profit after tax and minority interests (PATMI) reaching 105% and 103% of expectations respectively. Revenue expanded substantially by 27% year-on-year to S$276 million, primarily supported by U-Mobile 4PL services. However, adjusted PATMI grew at a more modest 20% year-on-year to S$4.4 million due to inventory provisioning impacts. Shareholders benefited from a significant dividend increase, with FY25 dividends more than tripling to 0.45 cents. Personal Communications System Drives Growth The personal communications system segment remained the company's primary growth engine, with revenue surging 42% year-on-year to S$200 million. This impressive growth was fuelled by U-Mobile's expanding subscriber base and the increasing adoption of higher-value postpaid plans requiring handset subsidies. TeleChoice strategically expanded its retail footprint by increasing outlet numbers, broadening its device portfolio, and introducing additional accessories to capture greater market share. Challenges and Outlook Despite the strong revenue performance, TeleChoice faced headwinds from higher inventory provisions. The company experienced a significant spike in inventory write-downs, with provisions increasing by S$2.5 million to S$3.8 million. This provisioning was attributed to a S$11 million year-on-year rise in inventory levels during FY25, compared to S$9.3 million in FY24. Research Recommendation and Valuation Phillip Securities Research maintains its BUY recommendation on TeleChoice International, raising the target price to S$0.275 from the previous S$0.215. The firm increased its FY26e PATMI forecast by 13% to S$8.3 million. The valuation is based on a 15x price-to-earnings multiple for FY26e, benchmarked against SGX-listed companies in the system integration and software sectors. The research house noted that growth momentum in PCS remains intact, with network engineering showing signs of recovery through managed services and network buildout projects in Indonesia and Malaysia. Additionally, TeleChoice is evaluating expansion opportunities into higher-growth digital infrastructure segments, including data centres. Frequently Asked Questions Q: What were TeleChoice's key financial results for FY25? A: TeleChoice achieved revenue of S$276 million, representing 27% year-on-year growth, and adjusted PATMI of S$4.4 million, up 20% year-on-year. Results were within expectations at 105% and 103% of forecasts respectively. Q: Which business segment drove the strongest growth? A: The personal communications system (PCS) segment was the key growth driver, with revenue jumping 42% year-on-year to S$200 million, supported by U-Mobile subscriber growth and higher postpaid plans. Q: What challenges did the company face during FY25? A: TeleChoice experienced higher inventory provisions, with write-downs increasing by S$2.5 million to S$3.8 million due to a S$11 million year-on-year rise in inventory levels. Q: What is Phillip Securities Research's recommendation and target price? A: Phillip Securities Research maintains a BUY recommendation with a raised target price of S$0.275, up from the previous S$0.215, based on 15x P/E for FY26e. Q: How did dividends perform in FY25? A: FY25 dividends more than tripled to 0.45 cents, representing a 260% increase from the previous year's 0.125 cents. Q: What expansion opportunities is TeleChoice considering? A: The company announced it is evaluating expansion into higher-growth segments within digital infrastructure, including data centres, whilst network engineering is recovering through managed services and projects in Indonesia and Malaysia. Q: What factors contributed to the PCS segment's strong performance? A: Growth was driven by U-Mobile 5G subscribers, additional retail stores, postpaid handset subsidies, a widening range of devices, and expanded accessories offerings. This article has been auto-generated using PhillipGPT. It is based on a report by a Phillip Securities Research analyst. Disclaimer These commentaries are intended for general circulation and do not have regard to the specific investment objectives, financial situation and particular needs of any person. Accordingly, no warranty whatsoever is given and no liability whatsoever is accepted for any loss arising whether directly or indirectly as a result of any person acting based on this information. You should seek advice from a financial adviser regarding the suitability of any investment product(s) mentioned herein, taking into account your specific investment objectives, financial situation or particular needs, before making a commitment to invest in such products. Opinions expressed in these commentaries are subject to change without notice. Investments are subject to investment risks including the possible loss of the principal amount invested. The value of units in any fund and the income from them may fall as well as rise. Past performance figures as well as any projection or forecast used in these commentaries are not necessarily indicative of future or likely performance. Phillip Securities Pte Ltd (PSPL), its directors, connected persons or employees may from time to time have an interest in the financial instruments mentioned in these commentaries. The information contained in these commentaries has been obtained from public sources which PSPL has no reason to believe are unreliable and any analysis, forecasts, projections, expectations and opinions (collectively the “Research”) contained in these commentaries are based on such information and are expressions of belief only. PSPL has not verified this information and no representation or warranty, express or implied, is made that such information or Research is accurate, complete or verified or should be relied upon as such. Any such information or Research contained in these commentaries are subject to change, and PSPL shall not have any responsibility to maintain the information or Research made available or to supply any corrections, updates or releases in connection therewith. In no event will PSPL be liable for any special, indirect, incidental or consequential damages which may be incurred from the use of the information or Research made available, even if it has been advised of the possibility of such damages. The companies and their employees mentioned in these commentaries cannot be held liable for any errors, inaccuracies and/or omissions howsoever caused. Any opinion or advice herein is made on a general basis and is subject to change without notice. The information provided in these commentaries may contain optimistic statements regarding future events or future financial performance of countries, markets or companies. You must make your own financial assessment of the relevance, accuracy and adequacy of the information provided in these commentaries. Views and any strategies described in these commentaries may not be suitable for all investors. Opinions expressed herein may differ from the opinions expressed by other units of PSPL or its connected persons and associates. Any reference to or discussion of investment products or commodities in these commentaries is purely for illustrative purposes only and must not be construed as a recommendation, an offer or solicitation for the subscription, purchase or sale of the investment products or commodities mentioned. This advertisement has not been reviewed by the Monetary Authority of Singapore.

Singapore Banking Sector Faces Mixed Outlook as Rates Stabilise
Interest Rate Environment Shows Signs of Stabilisation Singapore's banking sector is navigating a transitional period as interest rate declines begin to moderate. Feb's 3-month Singapore Overnight Rate Average (3M-SORA) fell by just 2 basis points month-on-month to 1.16%, marking the smallest monthly decline in 20 months. Year-on-year, the rate decreased by 168 basis points, representing the smallest annual decline in eight months. This deceleration suggests that the sharp downward pressure on interest rates may be easing. The moderation in rate declines comes as Singapore continues to attract capital inflows, with foreign exchange reserves rising 10% year-on-year in Feb 2026, reinforcing the city-state's position as a regional safe haven. Meanwhile, Hong Kong's 3-month Hong Kong Interbank Offered Rate (3M-HIBOR) declined 18 basis points month-on-month to 2.69% in Feb, continuing its fourth consecutive month of decreases. Banking Performance Reflects Sector Headwinds Singapore's major banks reported fourth-quarter 2025 earnings that fell slightly below market expectations, with overall earnings declining 5% year-on-year. This performance was primarily driven by a 5% decrease in net interest income as net interest margins compressed by 22 basis points year-on-year. However, robust fee income growth of 13% helped partially offset the decline in traditional lending income. The banking sector has shown resilience through improved deposit dynamics. Current Account and Savings Account (CASA) balances rose 12% year-on-year, whilst the CASA ratio to total deposits increased to 19.8% in Dec 2025 from 19.6% previously. This improvement in low-cost funding provides banks with a cushion against margin compression and helps lower overall funding costs. Outlook and Investment Stance Phillip Securities Research maintains a NEUTRAL stance on the Singapore banking sector, acknowledging both challenges and opportunities ahead. The research house expects fiscal year 2026 profit after tax and minority interests to increase by 7% year-on-year, supported by continued fee income growth despite ongoing pressure on net interest income. Banks are providing guidance for low to mid-single digit loan growth, with Singapore loan growth continuing to climb at 6.1% as of Jan 2026. Management teams across the sector indicate that net interest margin compression should begin to ease in fiscal year 2026 as deposit rate cuts flow through and interest rates stabilise. The research highlights that increased market volatility and higher Singapore Dollar Average Volume are boosting capital markets and fee income, helping to offset traditional banking headwinds. Additionally, rising oil prices present inflation risks that could potentially delay further rate cuts, providing some support for margins. Despite asset quality concerns at United Overseas Bank, analysts view the bank's pre-emptive provisioning approach as prudent, with overall sector risks considered contained. All three major Singapore banks have committed to completing their previously announced capital return programmes, whilst dividend yields remain attractive at 5.1% with ongoing share buybacks improving return on equity. Frequently Asked Questions Q: How did Singapore banks perform in the fourth quarter of 2025? A: Fourth-quarter 2025 bank earnings were slightly below expectations, with earnings declining 5% year-on-year primarily due to lower net interest income, though this was partially offset by 13% growth in fee income. Q: What is the outlook for net interest margins in 2026? A: Banks are guiding that net interest margin compression should ease in fiscal year 2026 as deposit rate cuts begin to flow through and interest rates stabilise, following a 22 basis point year-on-year decline in the fourth quarter. Q: How are deposit trends supporting the banks? A: CASA balances rose 12% year-on-year with the CASA ratio to deposits improving to 19.8%, providing a tailwind for banks by lowering funding costs and cushioning net interest margin compression. Q: What factors could support banking margins going forward? A: Rising oil prices raise inflation risks that could potentially delay further rate cuts, whilst increased market volatility is boosting capital markets and fee income to help offset traditional banking headwinds. Q: What is the expected profit growth for Singapore banks in 2026? A: Phillip Securities Research expects fiscal year 2026 profit after tax and minority interests to increase by 7% year-on-year, as fee income growth will be partially offset by declining net interest income. Q: What are the key risks facing the banking sector? A: The main challenges include continued net interest margin compression from declining interest rates and asset quality concerns, though overall risks are viewed as contained with banks taking prudent provisioning approaches. Q: How attractive are Singapore bank dividends currently? A: Banks' dividend yields remain attractive at 5.1%, with all three major banks committed to completing their previously announced capital return plans and ongoing share buybacks improving return on equity. This article has been auto-generated using PhillipGPT. It is based on a report by a Phillip Securities Research analyst. Disclaimer These commentaries are intended for general circulation and do not have regard to the specific investment objectives, financial situation and particular needs of any person. Accordingly, no warranty whatsoever is given and no liability whatsoever is accepted for any loss arising whether directly or indirectly as a result of any person acting based on this information. You should seek advice from a financial adviser regarding the suitability of any investment product(s) mentioned herein, taking into account your specific investment objectives, financial situation or particular needs, before making a commitment to invest in such products. Opinions expressed in these commentaries are subject to change without notice. Investments are subject to investment risks including the possible loss of the principal amount invested. The value of units in any fund and the income from them may fall as well as rise. Past performance figures as well as any projection or forecast used in these commentaries are not necessarily indicative of future or likely performance. Phillip Securities Pte Ltd (PSPL), its directors, connected persons or employees may from time to time have an interest in the financial instruments mentioned in these commentaries. The information contained in these commentaries has been obtained from public sources which PSPL has no reason to believe are unreliable and any analysis, forecasts, projections, expectations and opinions (collectively the “Research”) contained in these commentaries are based on such information and are expressions of belief only. PSPL has not verified this information and no representation or warranty, express or implied, is made that such information or Research is accurate, complete or verified or should be relied upon as such. Any such information or Research contained in these commentaries are subject to change, and PSPL shall not have any responsibility to maintain the information or Research made available or to supply any corrections, updates or releases in connection therewith. In no event will PSPL be liable for any special, indirect, incidental or consequential damages which may be incurred from the use of the information or Research made available, even if it has been advised of the possibility of such damages. The companies and their employees mentioned in these commentaries cannot be held liable for any errors, inaccuracies and/or omissions howsoever caused. Any opinion or advice herein is made on a general basis and is subject to change without notice. The information provided in these commentaries may contain optimistic statements regarding future events or future financial performance of countries, markets or companies. You must make your own financial assessment of the relevance, accuracy and adequacy of the information provided in these commentaries. Views and any strategies described in these commentaries may not be suitable for all investors. Opinions expressed herein may differ from the opinions expressed by other units of PSPL or its connected persons and associates. Any reference to or discussion of investment products or commodities in these commentaries is purely for illustrative purposes only and must not be construed as a recommendation, an offer or solicitation for the subscription, purchase or sale of the investment products or commodities mentioned. This advertisement has not been reviewed by the Monetary Authority of Singapore.

Oiltek International Shows Resilient Performance Amid Order Book Challenges
Company Overview Oiltek International Ltd operates as an engineering, procurement, construction and commissioning (EPCC) contractor specialising in oil refining and renewable energy projects. The company maintains an asset-light business model with strong return on equity metrics, positioning itself as a key player in the sustainable aviation fuel and biodiesel sectors. Financial Performance and Dividend Growth The company delivered solid financial results for FY25, with adjusted profit after tax and minority interest (PATMI) reaching 101% of forecasted expectations. Whilst revenue fell short at 83% of projections, Oiltek demonstrated strong operational efficiency through improved gross margins, which climbed to 32.8% in the second half of FY25. This margin expansion reflected the proprietary nature of projects, procurement savings, and successful project completions, maintaining strength despite a stronger ringgit. The company rewarded shareholders with a 33% increase in dividend per share to 1.2 cents. Market Challenges and Strategic Positioning New orders secured during FY25 totalled RM152 million, representing a decline from the previous year's RM207 million. This softening was attributed to changes in Indonesian palm oil policies and the company's strategic pivot towards recurrent income projects. The order book decreased by 12% year-on-year to RM312.8 million from RM354.9 million, though February announcements of RM37.2 million in new contracts helped rebuild the order book to RM350 million. Growth Prospects and Market Opportunities The sustainable aviation fuel market presents significant growth opportunities, with global demand expected to surge from 1.9 million tonnes in 2025 to 7.8 million tonnes by 2030. Recent oil price increases and the drive for energy self-sufficiency are anticipated to accelerate demand for both sustainable aviation fuel and biodiesel. Oiltek is well-positioned to capitalise on these trends through EPCC contracts, ownership stakes in sustainable aviation fuel plants, and contracts in refinery and biodiesel facilities. Investment Outlook Phillip Securities Research maintains its target price of S$1.18, valuing Oiltek at 35 times FY26 price-to-earnings ratio—a premium to Malaysian listed peers reflecting the company's strong earnings growth profile. The firm expects a significant rebound in orders for FY26, driven by both refining and renewable energy projects. With a RM100 million net cash position and 35% return on equity, Oiltek maintains financial flexibility whilst operating an efficient asset-light model. Frequently Asked Questions Q: What was Oiltek's financial performance in FY25? A: Oiltek's FY25 adjusted PATMI was within expectations at 101% of forecast, though revenue was below expectations at 83% of projections. The company increased its dividend per share by 33% to 1.2 cents. Q: How did Oiltek's gross margins perform? A: Gross margins improved significantly, climbing to 32.8% in 2H25, up from 27.4% previously. This 5.4 percentage point increase was driven by procurement savings, project completions, and the proprietary nature of projects. Q: What caused the decline in new orders? A: New orders fell to RM152 million in FY25 from RM207 million in FY24, primarily due to changes in Indonesian palm oil policies and the company's strategic pivot towards recurrent income projects. Q: What is the current status of Oiltek's order book? A: The order book declined 12% year-on-year to RM312.8 million, but recovered to RM350 million in February 2026 following the announcement of RM37.2 million in new contracts. Q: What growth opportunities does Oiltek face? A: The company is positioned to benefit from surging sustainable aviation fuel demand, expected to grow from 1.9 million tonnes in 2025 to 7.8 million tonnes by 2030, alongside opportunities in biodiesel and refinery projects. Q: What is Phillip Securities Research's recommendation? A: The research house maintains a target price of S$1.18, valuing Oiltek at 35 times FY26 PE ratio—a premium to Malaysian peers due to strong earnings growth prospects. Q: What are Oiltek's key financial strengths? A: The company maintains an asset-light business model with a 35% return on equity and holds RM100 million in net cash, providing financial flexibility for future growth opportunities. This article has been auto-generated using PhillipGPT. It is based on a report by a Phillip Securities Research analyst. Disclaimer These commentaries are intended for general circulation and do not have regard to the specific investment objectives, financial situation and particular needs of any person. Accordingly, no warranty whatsoever is given and no liability whatsoever is accepted for any loss arising whether directly or indirectly as a result of any person acting based on this information. You should seek advice from a financial adviser regarding the suitability of any investment product(s) mentioned herein, taking into account your specific investment objectives, financial situation or particular needs, before making a commitment to invest in such products. Opinions expressed in these commentaries are subject to change without notice. Investments are subject to investment risks including the possible loss of the principal amount invested. The value of units in any fund and the income from them may fall as well as rise. Past performance figures as well as any projection or forecast used in these commentaries are not necessarily indicative of future or likely performance. Phillip Securities Pte Ltd (PSPL), its directors, connected persons or employees may from time to time have an interest in the financial instruments mentioned in these commentaries. The information contained in these commentaries has been obtained from public sources which PSPL has no reason to believe are unreliable and any analysis, forecasts, projections, expectations and opinions (collectively the “Research”) contained in these commentaries are based on such information and are expressions of belief only. PSPL has not verified this information and no representation or warranty, express or implied, is made that such information or Research is accurate, complete or verified or should be relied upon as such. Any such information or Research contained in these commentaries are subject to change, and PSPL shall not have any responsibility to maintain the information or Research made available or to supply any corrections, updates or releases in connection therewith. In no event will PSPL be liable for any special, indirect, incidental or consequential damages which may be incurred from the use of the information or Research made available, even if it has been advised of the possibility of such damages. The companies and their employees mentioned in these commentaries cannot be held liable for any errors, inaccuracies and/or omissions howsoever caused. Any opinion or advice herein is made on a general basis and is subject to change without notice. The information provided in these commentaries may contain optimistic statements regarding future events or future financial performance of countries, markets or companies. You must make your own financial assessment of the relevance, accuracy and adequacy of the information provided in these commentaries. Views and any strategies described in these commentaries may not be suitable for all investors. Opinions expressed herein may differ from the opinions expressed by other units of PSPL or its connected persons and associates. Any reference to or discussion of investment products or commodities in these commentaries is purely for illustrative purposes only and must not be construed as a recommendation, an offer or solicitation for the subscription, purchase or sale of the investment products or commodities mentioned. This advertisement has not been reviewed by the Monetary Authority of Singapore.

Geo Energy Resources Poised for Strong Growth Despite Tax Rate Challenges
Company Overview Geo Energy Resources Ltd is a coal mining company operating in Indonesia, with multiple mining assets including PT Tanah Bumbu Resources (TBR), PT Triaryani (TRA), and PT Sungai Danau Jaya (SDJ) mines. The company is focused on expanding its production capacity and developing new infrastructure to support its growth ambitions. Mixed FY25 Performance Results Geo Energy Resources delivered mixed results for FY25, with revenue performance exceeding expectations whilst earnings fell short of forecasts. The company achieved FY25 revenue and profit after tax and minority interests (PATMI) of 113% and 70% of Phillip Securities Research's FY25 estimates respectively. However, earnings were significantly impacted by an unexpected surge in the effective tax rate. Tax Rate Challenges Impact Profitability The most significant headwind facing Geo Energy was a dramatic increase in its effective tax rate, which spiked to 63% compared to the estimated 22%. This substantial deviation occurred due to Indonesian authorities changing the basis for taxable income calculations. The new methodology uses the domestic Harga Patokan Batubara (HPB) coal price rather than Geo's actual export prices. The HPB price was unusually elevated during June-July, creating a much larger gap than the typical US$1-2 difference, thereby significantly increasing the company's tax burden. Strong Production Growth and Infrastructure Development Despite the tax challenges, Geo Energy demonstrated robust operational performance. Coal production in the second half of FY25 jumped 20% year-on-year to 5.9 million tonnes. This increase was primarily driven by stronger output from the TBR mine, which contributed an additional 1.1 million tonnes, and TRA mine, which added 0.4 million tonnes. However, SDJ mine production declined by 0.5 million tonnes to 0.3 million tonnes and is expected to cease production in 2026. The company is making significant progress on its major infrastructure project - a 92-kilometre hauling road and jetty costing US$190 million. This critical infrastructure is currently 80% complete and will undergo testing and commissioning from April 2026, with commercial usage planned for August-September. Phillip Securities Research models that 2.5 million tonnes of coal will be shipped through this new infrastructure in the fourth quarter of 2026. Analyst Outlook and Recommendations Phillip Securities Research maintains its BUY recommendation for Geo Energy Resources and has raised its DCF target price to S$0.75 from the previous S$0.59. This price increase reflects a reduction in the infrastructure discount from 60% to 50%. The research house maintains its FY26 earnings estimates and identifies what it calls a "trifecta boost" in earnings potential from recovering coal prices, doubled coal production capacity, and new fee income from road usage and transportation services. The analysts forecast production to remain stable at 12 million tonnes in FY26, before spiking significantly to 20 million tonnes in FY27. Supporting this optimistic outlook, coal prices are showing signs of recovery, moving from the US$40s to the US$50s range. Frequently Asked Questions Q: What was Geo Energy's FY25 financial performance compared to expectations? A: FY25 revenue exceeded expectations at 113% of forecasts, but earnings disappointed at only 70% of estimates due to a significant increase in the effective tax rate from an estimated 22% to 63%. Q: Why did the effective tax rate increase so dramatically? A: Indonesian authorities changed the taxable income computation method, using the domestic Harga Patokan Batubara (HPB) coal price rather than Geo Energy's actual export prices. The HPB price was unusually high during June-July, creating a much larger tax burden than the typical US$1-2 difference. Q: How did coal production perform in 2H25? A: Coal production jumped 20% year-on-year to 5.9 million tonnes in the second half of FY25, primarily driven by increases from TBR mine (+1.1mn tonnes) and TRA mine (+0.4mn tonnes), whilst SDJ mine production fell by 0.5mn tonnes. Q: What is the status of Geo Energy's major infrastructure project? A: The 92-kilometre US$190 million hauling road and jetty is 80% complete. Testing and commissioning will begin in April 2026, with commercial usage planned for August-September 2026. Q: What is Phillip Securities Research's recommendation and target price? A: Phillip Securities Research maintains a BUY recommendation and has raised the DCF target price to S$0.75 from the previous S$0.59, reflecting a reduction in the infrastructure discount from 60% to 50%. Q: What are the production forecasts for FY26 and FY27? A: Production is forecast to remain stable at 12 million tonnes in FY26, then spike significantly to 20 million tonnes in FY27 as the new infrastructure becomes operational. Q: How are coal prices performing? A: Coal prices are showing signs of recovery, moving from the US$40s to the US$50s range, which supports the positive outlook for the company. Q: What is the "trifecta boost" mentioned by analysts? A: The trifecta boost refers to three factors expected to drive earnings growth: rebounding coal prices, a doubling of coal production capacity, and new fee income from road usage and transportation services. This article has been auto-generated using PhillipGPT. It is based on a report by a Phillip Securities Research analyst. Disclaimer These commentaries are intended for general circulation and do not have regard to the specific investment objectives, financial situation and particular needs of any person. Accordingly, no warranty whatsoever is given and no liability whatsoever is accepted for any loss arising whether directly or indirectly as a result of any person acting based on this information. You should seek advice from a financial adviser regarding the suitability of any investment product(s) mentioned herein, taking into account your specific investment objectives, financial situation or particular needs, before making a commitment to invest in such products. Opinions expressed in these commentaries are subject to change without notice. Investments are subject to investment risks including the possible loss of the principal amount invested. The value of units in any fund and the income from them may fall as well as rise. Past performance figures as well as any projection or forecast used in these commentaries are not necessarily indicative of future or likely performance. Phillip Securities Pte Ltd (PSPL), its directors, connected persons or employees may from time to time have an interest in the financial instruments mentioned in these commentaries. The information contained in these commentaries has been obtained from public sources which PSPL has no reason to believe are unreliable and any analysis, forecasts, projections, expectations and opinions (collectively the “Research”) contained in these commentaries are based on such information and are expressions of belief only. PSPL has not verified this information and no representation or warranty, express or implied, is made that such information or Research is accurate, complete or verified or should be relied upon as such. Any such information or Research contained in these commentaries are subject to change, and PSPL shall not have any responsibility to maintain the information or Research made available or to supply any corrections, updates or releases in connection therewith. In no event will PSPL be liable for any special, indirect, incidental or consequential damages which may be incurred from the use of the information or Research made available, even if it has been advised of the possibility of such damages. The companies and their employees mentioned in these commentaries cannot be held liable for any errors, inaccuracies and/or omissions howsoever caused. Any opinion or advice herein is made on a general basis and is subject to change without notice. The information provided in these commentaries may contain optimistic statements regarding future events or future financial performance of countries, markets or companies. You must make your own financial assessment of the relevance, accuracy and adequacy of the information provided in these commentaries. Views and any strategies described in these commentaries may not be suitable for all investors. Opinions expressed herein may differ from the opinions expressed by other units of PSPL or its connected persons and associates. Any reference to or discussion of investment products or commodities in these commentaries is purely for illustrative purposes only and must not be construed as a recommendation, an offer or solicitation for the subscription, purchase or sale of the investment products or commodities mentioned. This advertisement has not been reviewed by the Monetary Authority of Singapore.


