
Return on Invested Capital (ROIC)
Table of Contents
- What is ROIC?
- Formula and Calculation of ROIC
- Calculating NOPAT
- Calculating invested capital
- Determining the Value of a Company
- Determining a Company’s Competitiveness
- Relevance and Uses of Return on Invested Capital Formula
- How to Use ROIC
- ROIC vs WACC
- Value Drivers of ROIC
- Components of ROIC
- Limitations of ROIC
- Frequently Asked Questions
What is ROIC?
Return on Invested Capital (ROIC) is the amount of money a company makes that is above the average cost of its debt and equity capital. ROIC can also be assessed or used to determine the value of other businesses or rival companies.
Formula and Calculation of ROIC
The calculation of ROIC is done by dividing the net operating profit after tax (NOPAT) by the invested capital.
ROIC = NOPAT /Invested CapitalNOPATInvested Capital
ROIC can also be calculated through another method,
ROIC = Net Income − Dividends/ Debt +Equity
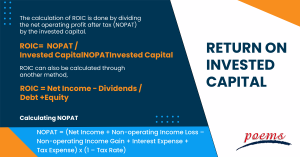
Calculating NOPAT
NOPAT is a financial measure that shows the performance of the company net of taxes. It can be calculated using the following formula;
NOPAT = (Net Income + Non-operating Income Loss – Non-operating Income Gain + Interest Expense + Tax Expense) x (1 – Tax Rate)
Calculating invested capital
Invested Capital is the total amount invested by shareholders, debt holders, and other lenders. It can be calculated by:
Invested Capital = Net Working Capital + Net Fixed Assets + Net Intangible Assets
Determining the Value of a Company
Determining the value of a company is very important to ensure proper valuation. There are various methods through which one can determine the value of a company. Some of them are:
- Asset Approach: It calculates all the assets and liabilities of a company. Then the liabilities are subtracted from the assets.
- Market Approach: It makes use of the company’s position in the stock market.
- Income Approach: It is determined by dividing the annual earnings of the company by the current capitalization rate.
Determining a Company’s Competitiveness
A company is considered to be a strong competitor if it earns more profits than its rivals. A company’s competitiveness can be determined by its market profile, customer segments, strengths, weaknesses, and position in the landscape, and method for delivering value. These aspects than can be compared with the same aspects of other companies to determine its position. Its position in the market, including respect, prices and stocks, can also be used as competitive measures
Relevance and Uses of Return on Invested Capital Formula
The ROIC formula is used in various sectors to assess how well the company has used its resources to yield maximum profit. It also has great relevance as it helps to compare the competitiveness and position of the company against its rival and how well it is doing in the sector. The formula can also be used to measure the amount of money that the company makes from its investment.
How to Use ROIC
Let’s take the example of a company UVC. If the company has generated $1,00,00,000 in profits and has invested an average of $10,00,00,000, then ROIC is said to be equal to 10%. This means that the company generates $10 of net earnings for every $100 invested in the company.
ROIC vs WACC
ROIC is the amount of money a firm makes that is above the average cost of its debt and equity capital. Weighted Average Cost of Capital (WACC) represents a company’s total cost of capital, including common stock, preferred stock, bonds, and other types of debt. If a firm is generating more ROIC than WACC, then it means that the company is creating value, and if a firm is generating more WACC than ROIC, then it means that the company is destroying value.
Value Drivers of ROIC
The value of ROIC is the product of invested capital turnover (revenue generated by each dollar spent), and margins (how much profit is retained after deducting costs). These two factors are important drivers of value when it comes to ROIC, to optimally assess profit.
Components of ROIC
ROIC has the following components:
ROIC Components = Revenue / Average Invested Capital × NOPAT / Revenue
Limitations of ROIC
While ROIC helps assess a company’s profit, it has some downsides to it. It tells us nothing about which part of the business is generating profit. It also does not take into account the holding periods of investment. There are also various possibilities of the measure being manipulated if the expected costs are not met.
Frequently Asked Questions
A good ROIC ratio is 2% or more as it indicates that the company is producing value. A score of less than 2% shows that the company is destroying value and is not utilising capital optimally.
The basic difference between ROI and ROIC is that ROIC takes into consideration every aspect of the company, including its activities. On the other hand, ROIC uses only a single activity based on cash flow and has no fixed time.
As a lower ROIC indicates an unsustainable business model, a higher ROIC is always better. A high ROIC ratio indicates that the industry is growing positively and in the right direction.
Net Income = $3,75,00,000
Total Debt = $2,50,00,000
Shareholder Equity = $65,00,000
The ROIC will be:
ROIC = 3,75,00,000 − 0/2,50,00,000 +65,00,000
= 3,75,00,000/3,15,00,000
= 1.19%
In the stock market, ROIC indicates the profits a firm has earned above the expenditures. It indicates how well a firm has used its resources or assets to generate profits.
This is because it represents recurrent core operational profits and is an unlevered measure. NOPAT is commonly employed in the numerator and is thus unaffected by the capital structure.
Related Terms
- Investment adviser public disclosure
- Price-to-Book Ratio
- Investment adviser registration depository
- Contingent deferred sales charges
- Net asset value (NAV)
- CAGR
- Mark-to-market
- Federal Open Market Committee
- FIRE
- Applicable federal rate
- Automated teller machine
- Central limit theorem
- Balanced scorecard
- Analysis of variance
- Annual Percentage rate
- Double Taxation Agreement
- Floating Rate Notes
- Average True Range (ATR)
- Constant maturity treasury
- Employee stock option
- Hysteresis
- RevPAR
- REITS
- General and administrative expenses
- OPEX
- ARPU
- WACC
- DCF
- NPL
- Capital expenditure (Capex)
- Balance of trade (BOT)
- Retail price index (RPI)
- Unit investment trust (UIT)
- SPAC
- GAAP
- GDPR
- GATT
- Irrevocable Trust
- Line of credit
- Coefficient of Variation (CV)
- Creative Destruction (CD)
- Letter of credits (LC)
- Statement of additional information
- Year to date
- Certificate of deposit
- Price-to-earnings (P/E) ratio
- Individual retirement account (IRA)
- Quantitative easing
- Yield to maturity
- Rights of accumulation (ROA)
- Letter of Intent
- Return on Equity (ROE)
- Return on Assets (ROA)
Most Popular Terms
Other Terms
- Bond Convexity
- Compound Yield
- Brokerage Account
- Discretionary Accounts
- Industry Groups
- Growth Rate
- Green Bond Principles
- Gamma Scalping
- Funding Ratio
- Free-Float Methodology
- Foreign Direct Investment (FDI)
- Floating Dividend Rate
- Flight to Quality
- Real Return
- Protective Put
- Perpetual Bond
- Option Adjusted Spread (OAS)
- Non-Diversifiable Risk
- Merger Arbitrage
- Liability-Driven Investment (LDI)
- Income Bonds
- Guaranteed Investment Contract (GIC)
- Flash Crash
- Equity Carve-Outs
- Cost of Equity
- Cost Basis
- Deferred Annuity
- Cash-on-Cash Return
- Earning Surprise
- Capital Adequacy Ratio (CAR)
- Bubble
- Beta Risk
- Bear Spread
- Asset Play
- Accrued Market Discount
- Ladder Strategy
- Junk Status
- Intrinsic Value of Stock
- Interest-Only Bonds (IO)
- Interest Coverage Ratio
- Inflation Hedge
- Industry Groups
- Incremental Yield
- Industrial Bonds
- Income Statement
- Holding Period Return
- Historical Volatility (HV)
- Hedge Effectiveness
- Flat Yield Curve
- Fallen Angel
Know More about
Tools/Educational Resources
Markets Offered by POEMS
Read the Latest Market Journal

US-Domiciled ETFs Vs Ireland-Domiciled (UCITS) ETFs: Which Is Better For Singapore Investors?
Why Your Dividend Looks Smaller Than Expected Imagine checking your brokerage account after a dividend payment and noticing that the amount is lower than you expected. It's a common moment of confusion for new ETF investors, and the usual suspects — fund fees or weak performance — are rarely the real cause. In reality, one of the biggest and most overlooked factors is withholding tax, and specifically, where the ETF you hold is domiciled. For Singapore investors building exposure to the S&P 500, the Nasdaq 100, or global equities, understanding ETF domicile can meaningfully improve long-term, after-tax returns, without taking on any additional investment risk. This article looks at what domicile actually means, why Ireland-domiciled funds have become the default choice for so many non-US investors, how the dividend withholding tax math plays out in practice, and where a US-domiciled ETF might still make more sense. What Is ETF Domicile? ETF domicile refers to the country in which a fund is legally registered and regulated. It is a separate question from which market or index the ETF actually tracks — a fund can be domiciled in one country while investing entirely in the stocks of another. Here's a simple illustration using a few common S&P 500 ETFs: ETF Domicile VOO United States IVV United States CSPX Ireland VUAA Ireland Although CSPX and VOO both track the same S&P 500 Index, they are legally structured in different jurisdictions and operate under different regulatory regimes. That difference quietly shapes how dividends are taxed before they reach you, whether dividends are paid out or reinvested automatically and which regulator oversees the fund. Why Ireland-Domiciled ETFs Are Popular With Singapore Investors Same Markets, Different Wrapper Ireland-domiciled ETFs can give exposure to the same underlying markets as their US counterparts, including the S&P 500, the Nasdaq 100, the MSCI World Index, emerging markets, and global bonds. Choosing an Ireland-domiciled fund over a US-domiciled one isn't about giving up market access — you still own, indirectly, the same underlying companies. The difference lies mainly in the legal and tax structure wrapped around that exposure. UCITS: A Recognised Investor-Protection Framework Most Ireland-domiciled ETFs are structured as UCITS funds, short for Undertakings for Collective Investment in Transferable Securities — a European Union framework that governs how retail investment funds are run. It covers areas such as diversification limits, which prevent a fund from taking outsized exposure to a single issuer; transparency standards that include daily portfolio disclosure for most ETFs; independent custody of fund assets; and oversight by an EU regulator. For Ireland-domiciled funds, this regulator is the Central Bank of Ireland. Because of this, UCITS funds are widely regarded as among the most heavily regulated retail investment products available anywhere in the world. This is part of why they're distributed so widely outside Europe, including across Asia, the Middle East and Latin America. The Real Cost: Dividend Withholding Tax This is usually the single biggest factor in the US-versus-Ireland decision — bigger, in dollar terms, than the small gap in expense ratios that most investors fixate on. How US-Domiciled ETFs Are Taxed When a US-domiciled ETF pays a dividend to a non-US investor, the Internal Revenue Service (IRS) withholds tax at source. The default rate is 30%, and this applies in full unless the investor's home country has a tax treaty with the US that lowers it. Singapore does not have such a treaty for individual investors, so Singapore-based holders of US-domiciled ETFs generally face the full 30% rate on US-source dividends. Dividend Received Withholding Tax (30%) Investor Receives US$100 US$30 US$70 How Ireland-Domiciled ETFs Are Taxed US companies held inside an Ireland-domiciled ETF still pay dividends as usual, and the US still withholds tax before that money reaches the fund. But under the US-Ireland double taxation treaty, the rate applied at fund level drops from 30% to 15%. Ireland itself does not generally add additional withholding tax, whether the fund pays that income out or reinvests it. Dividend Received Withholding Tax (15%) Fund Retains US$100 US$15 US$85 Why This Matters More Than the Expense Ratio Many investors compare ETFs purely by expense ratio, often a gap of just 0.03% to 0.07%, or a few basis points. The withholding tax gap, however, is 15 percentage points on every dollar of US-sourced dividend income. This is usually a far bigger drag in absolute terms once a fund has a meaningful yield. Suppose you hold US$50,000 in an S&P 500-tracking ETF yielding around 1.3% a year in dividends, or about US$650 in annual dividend income. On a US-domiciled ETF, withholding tax takes roughly US$195 of that. On an Ireland-domiciled fund, it takes about US$97.50. That's roughly US$97.50 a year staying inside your investment instead of going to the US Treasury — money that, left alone, keeps compounding. Case Study: IVV vs CSPX IVV and CSPX make a useful pair to compare directly, since both are run by the same issuer (BlackRock/iShares) and both track the same index — the S&P 500. However, they differ in the key areas affected by the ETF domicile. IVV CSPX Domicile United States Ireland Tracks S&P 500 S&P 500 Expense Ratio (TER) 0.03% 0.07% US Dividend Withholding Tax 30% 15% Dividend Handling Distributing Accumulating Despite tracking an identical index, CSPX's lower withholding-tax drag and automatic reinvestment of dividends mean a larger share of the underlying return stays inside the fund, year after year. Illustrating the Compounding Effect To isolate just the withholding-tax effect, assume US$50,000 is invested, with a constant 1.3% dividend yield reinvested each year, and identical price returns for both funds, since they track the same index. The only difference is the amount of after-tax dividend reinvested. Holding Period US-Domiciled (IVV) Ireland-Domiciled (CSPX) Difference 10 years ≈ US$54,740 ≈ US$55,810 ≈ US$1,070 20 years ≈ US$59,930 ≈ US$62,290 ≈ US$2,360 30 years ≈ US$65,610 ≈ US$69,530 ≈ US$3,910 Illustrative only. Assumes a constant 1.3% dividend yield, reinvested annually, with the withholding-tax effect isolated from price returns (which are excluded since both funds track the same index). Actual yields, tax treatment, and returns will vary, and this is not a forecast of future performance. Accumulating vs Distributing ETFs It's easy to mix up an ETF’s domicile with a dividend policy, even though they're two separate decisions. Domicile determines the tax treatment; accumulating versus distributing determines whether dividends are paid out in cash or reinvested automatically inside the fund. Most US-domiciled ETFs distribute by default, since US fund rules generally require regulated investment companies to pass through most of their income. Ireland-domiciled UCITS funds, by contrast, commonly offer both accumulating and distributing share classes side by side. Accumulating (Acc) funds reinvest dividends automatically inside the fund, which suits hands-off investors focused on long-term compounding. CSPX, VUAA, SWRD, CNDX and EIMI all fall into this category. Distributing (Dist) funds pay dividends out in cash, which suits income-focused investors who want regular payouts. VUSA, IUSA and VWRD are examples. One nuance worth flagging: choosing an accumulating share class does not avoid withholding tax. The 15% or 30% withholding tax is still deducted before the dividend is reinvested or paid out — "Acc" only changes what happens to the money afterwards, not whether tax was withheld in the first place. Popular Ireland-Domiciled ETFs for Singapore Investors A few of the more widely held Ireland-domiciled UCITS ETFs, grouped by the exposure they offer: Exposure Ticker Fund Dividend Treatment S&P 500 CSPX iShares Core S&P 500 UCITS ETF Accumulating S&P 500 VUAA Vanguard S&P 500 UCITS ETF (USD) Acc Accumulating S&P 500 VUSA Vanguard S&P 500 UCITS ETF Distributing Nasdaq 100 CNDX iShares Nasdaq 100 UCITS ETF Accumulating Global Equity (MSCI World) SWRD SPDR MSCI World UCITS ETF Accumulating Emerging Markets (MSCI EM IMI) EIMI iShares Core MSCI EM IMI UCITS ETF Accumulating All the funds above are domiciled in Ireland and generally benefit from the 15% US dividend withholding rate described earlier. Fund details and fees can change, so it's worth checking the current factsheet and Key Information Document before investing in any of them. Trade-Offs Worth Weighing Ireland-domiciled ETFs aren't automatically the right call in every situation. CSPX and VUAA charge around 0.07%, compared with 0.03% for IVV or VOO — a roughly four-basis-point gap that, for most investors with real US dividend exposure, is outweighed by the 15-percentage-point withholding tax saving, though it's worth checking against one’s own portfolio size and yield. The largest Ireland-domiciled funds, like CSPX, are highly liquid. However, smaller or newer UCITS ETFs can trade with wider bid-ask spreads than the largest US ETFs, where market depth is hard to beat. Currency is another factor: Ireland-domiciled ETFs are listed on European or UK exchanges and can be traded in USD, GBP or EUR depending on the listing, so it's worth checking your broker's FX conversion fees, which can offset some of the tax savings if you trade often. The US market also still has the deepest range of niche, sector, factor, and leveraged or inverse ETFs; UCITS equivalents exist for many core strategies but are more limited at the margins. Common Questions From Singapore Investors Do Singapore investors pay tax on US ETF dividends? Yes, generally — the US withholds 30% from dividends paid to Singapore-based investors holding US-domiciled ETFs, since Singapore does not have a tax treaty with the US that lowers this rate for individuals. Is CSPX automatically better than VOO for a Singapore investor? Not automatically. CSPX typically results in lower total tax drag; however, it comes at the cost of a slightly higher expense ratio. For most Singapore-based retail investors who aren't US persons, the Ireland-domiciled option tends to be more tax-efficient, but liquidity, listing currency, and your broker's fee structure are also worth comparing. Does "accumulating" mean the dividend escapes tax? No. Withholding tax is still deducted before reinvestment — accumulating funds simply removes the need to manually reinvest your payouts. Does Singapore tax capital gains on ETF investments? No. Singapore does not levy capital gains tax on individual investors, which is largely why this comparison focuses on dividend tax efficiency rather than capital gains. The Bottom Line There's no single answer that applies to every investor. The right call depends on how much of your portfolio is invested in US dividend-paying assets, how large your US-situs holdings might grow over time, your citizenship status, and how much weight you place on cost versus tax efficiency. As a general rule of thumb, most Singapore-based investors who aren't US persons and are building meaningful long-term exposure to US or global equities tend to come out ahead, after tax, with an Ireland-domiciled UCITS ETF rather than its US-domiciled equivalent — without giving up access to the same underlying markets. Trade Global Markets, Including London, With POEMS Once you've decided which domicile suits you, the next step is execution. Several Ireland-domiciled ETFs, including CSPX, VUAA, SWRD and CNDX, are listed on the London Stock Exchange (LSE)alongside their European listings. POEMS, Phillip Securities' trading platform, gives Singapore investors access to dozens of global exchanges — including the LSE, Singapore Stock Exchange (SGX), New York Stock Exchange (NYSE), NASDAQ and the Hong Kong Stock Exchange (HKEX) — through a single account, so you can manage your core Singapore portfolio and your global ETF exposure in one place. Trading hours and commission rates vary by market and change from time to time, so check the latest rates and hours on the POEMS website, or speak with a Trading Representative, before placing your first trade on the London market. Open an Account Now! References [1] IRS — NRA Withholding (statutory 30% rate on US-source income to foreign persons) — https://financialhorse.com/is-dca-the-best-way-to-buy-stocks/ [2]IRAS — Gains from Sale of Property, Shares and Financial Instruments —https://www.iras.gov.sg/taxes/individual-income-tax/basics-of-individual-income-tax/what-is-taxable-what-is-not/gains-from-sale-of-property-shares-and-financial-instruments [3]iShares (BlackRock) — Core S&P 500 UCITS ETF (CSPX) fund page —https://www.ishares.com/uk/individual/en/products/253743/ishares-sp-500-b-ucits-etf-acc-fund [4]iShares (BlackRock) — Core S&P 500 ETF (IVV) fund page —https://www.ishares.com/us/products/239726/ishares-core-sp-500-etf [5]justETF — Vanguard S&P 500 UCITS ETF (USD) Accumulating (VUAA) fund profile — https://www.justetf.com/en/etf-profile.html?isin=IE00BFMXXD54 [6]Bogleheads Wiki — Nonresident Alien Investors and Ireland Domiciled ETFs —https://www.bogleheads.org/wiki/Nonresident_alien_investors_and_Ireland_domiciled_ETFs [7]POEMS — London Stock Exchange (LSE) Market Access —https://www.poems.com.sg/markets/united-kingdom-lse/ Disclaimer These commentaries are intended for general circulation and do not have regard to the specific investment objectives, financial situation and particular needs of any person. Accordingly, no warranty whatsoever is given and no liability whatsoever is accepted for any loss arising whether directly or indirectly as a result of any person acting based on this information. You should seek advice from a financial adviser regarding the suitability of any investment product(s) mentioned herein, taking into account your specific investment objectives, financial situation or particular needs, before making a commitment to invest in such products. Opinions expressed in these commentaries are subject to change without notice. Investments are subject to investment risks including the possible loss of the principal amount invested. The value of units in any fund and the income from them may fall as well as rise. Past performance figures as well as any projection or forecast used in these commentaries are not necessarily indicative of future or likely performance. Phillip Securities Pte Ltd (PSPL), its directors, connected persons or employees may from time to time have an interest in the financial instruments mentioned in these commentaries. The information contained in these commentaries has been obtained from public sources which PSPL has no reason to believe are unreliable and any analysis, forecasts, projections, expectations and opinions (collectively the “Research”) contained in these commentaries are based on such information and are expressions of belief only. PSPL has not verified this information and no representation or warranty, express or implied, is made that such information or Research is accurate, complete or verified or should be relied upon as such. Any such information or Research contained in these commentaries are subject to change, and PSPL shall not have any responsibility to maintain the information or Research made available or to supply any corrections, updates or releases in connection therewith. In no event will PSPL be liable for any special, indirect, incidental or consequential damages which may be incurred from the use of the information or Research made available, even if it has been advised of the possibility of such damages. The companies and their employees mentioned in these commentaries cannot be held liable for any errors, inaccuracies and/or omissions howsoever caused. Any opinion or advice herein is made on a general basis and is subject to change without notice. The information provided in these commentaries may contain optimistic statements regarding future events or future financial performance of countries, markets or companies. You must make your own financial assessment of the relevance, accuracy and adequacy of the information provided in these commentaries. Views and any strategies described in these commentaries may not be suitable for all investors. Opinions expressed herein may differ from the opinions expressed by other units of PSPL or its connected persons and associates. Any reference to or discussion of investment products or commodities in these commentaries is purely for illustrative purposes only and must not be construed as a recommendation, an offer or solicitation for the subscription, purchase or sale of the investment products or commodities mentioned. This advertisement has not been reviewed by the Monetary Authority of Singapore.

Netflix Upgraded to BUY on Strong Engagement and Pricing Power Despite Softer Guidance
Company Overview Netflix Inc. operates as the world's leading streaming entertainment service, providing original and licensed content across various genres to members in over 190 countries. The company generates revenue through subscription fees and advertising, supported by a multi-tier pricing strategy that includes ad-supported plans. Strong Fundamentals Drive Upgrade Decision Phillip Securities Research has upgraded Netflix from ACCUMULATE to BUY, maintaining its target price of US$110. The upgrade reflects the company's robust fundamentals despite recent stock price movements, with the forward FY26 P/E ratio at an attractive 18.8 times compared to the 5-year average of 36.25 times. Key Positives Highlight Competitive Strengths Netflix's pricing power remains a cornerstone of its competitive advantage. The March 2026 price increases across key markets, including the US, Mexico, and Spain, ranging from 8% to 12.5% across major plans, have been successfully absorbed without indication of elevated churn rates. The company's multi-tier pricing strategy, including lower-priced ad-supported plans, provides consumers with flexibility to trade down rather than cancel subscriptions entirely, supporting long-term average revenue per member growth. Engagement metrics demonstrate no signs of slowing momentum. Despite facing tougher comparisons and competition from major sporting events like the Winter Olympics and FIFA World Cup, Netflix maintained healthy engagement levels. Viewing hours reached 97 billion in the first half of 2026, representing 2% year-over-year growth compared to 1.5% in the previous year. This sustained engagement, combined with membership growth and pricing initiatives, supported 13% year-over-year revenue growth across all regions. The advertising business continues its impressive scaling trajectory, remaining on track to double revenue in FY26. Netflix plans to increase investment in films and series by 10% year-over-year, reinforcing confidence in its long-term content pipeline and commitment to maintaining its competitive moat through content quality. Near-Term Headwinds Present Modest Concerns The primary negative factor centres on slightly softer third-quarter guidance amid challenging content comparisons. Netflix projected 12% year-over-year revenue growth for 3Q26, representing a modest deceleration from recent quarters. This outlook reflects a less compelling second-half content slate relative to 2025, which benefited from blockbuster releases including Stranger Things, Wednesday, and Squid Game that drove exceptional engagement. Additionally, management did not announce new initiatives such as a free ad-supported television platform, contributing to a more muted near-term outlook due to the absence of fresh catalysts. Frequently Asked Questions [market_journal_faq] This article has been auto-generated using PhillipGPT. It is based on a report by a Phillip Securities Research analyst. Disclaimer These commentaries are intended for general circulation and do not have regard to the specific investment objectives, financial situation and particular needs of any person. Accordingly, no warranty whatsoever is given and no liability whatsoever is accepted for any loss arising whether directly or indirectly as a result of any person acting based on this information. You should seek advice from a financial adviser regarding the suitability of any investment product(s) mentioned herein, taking into account your specific investment objectives, financial situation or particular needs, before making a commitment to invest in such products. Opinions expressed in these commentaries are subject to change without notice. Investments are subject to investment risks including the possible loss of the principal amount invested. The value of units in any fund and the income from them may fall as well as rise. Past performance figures as well as any projection or forecast used in these commentaries are not necessarily indicative of future or likely performance. Phillip Securities Pte Ltd (PSPL), its directors, connected persons or employees may from time to time have an interest in the financial instruments mentioned in these commentaries. The information contained in these commentaries has been obtained from public sources which PSPL has no reason to believe are unreliable and any analysis, forecasts, projections, expectations and opinions (collectively the “Research”) contained in these commentaries are based on such information and are expressions of belief only. PSPL has not verified this information and no representation or warranty, express or implied, is made that such information or Research is accurate, complete or verified or should be relied upon as such. Any such information or Research contained in these commentaries are subject to change, and PSPL shall not have any responsibility to maintain the information or Research made available or to supply any corrections, updates or releases in connection therewith. In no event will PSPL be liable for any special, indirect, incidental or consequential damages which may be incurred from the use of the information or Research made available, even if it has been advised of the possibility of such damages. The companies and their employees mentioned in these commentaries cannot be held liable for any errors, inaccuracies and/or omissions howsoever caused. Any opinion or advice herein is made on a general basis and is subject to change without notice. The information provided in these commentaries may contain optimistic statements regarding future events or future financial performance of countries, markets or companies. You must make your own financial assessment of the relevance, accuracy and adequacy of the information provided in these commentaries. Views and any strategies described in these commentaries may not be suitable for all investors. Opinions expressed herein may differ from the opinions expressed by other units of PSPL or its connected persons and associates. Any reference to or discussion of investment products or commodities in these commentaries is purely for illustrative purposes only and must not be construed as a recommendation, an offer or solicitation for the subscription, purchase or sale of the investment products or commodities mentioned. This advertisement has not been reviewed by the Monetary Authority of Singapore.

Wells Fargo Delivers Strong Growth with 12% Loan Expansion, BUY Rating and US$115 Target Price
Company Overview Wells Fargo & Company is one of America's largest financial institutions, operating across multiple segments including Consumer Banking, Corporate and Investment Banking (CIB), and Wealth and Investment Management (WIM). The bank has been navigating regulatory constraints through an asset cap removal, which has now enabled significant balance sheet expansion opportunities. Strong Second Quarter Performance Wells Fargo reported impressive second quarter 2026 earnings of US$6.4 billion, representing a 17% year-on-year increase that slightly exceeded analyst estimates. The strong performance brought first-half earnings to 52% of the full-year forecast, demonstrating robust momentum. The bank achieved a return on tangible common equity (ROTCE) of 17.7%, up from 15.2% in the prior year quarter, whilst expenses rose only 2% despite significant business growth. Comprehensive Revenue Growth Across All Segments The bank delivered exceptional fee income growth, with non-interest income rising 13% year-on-year to US$10.3 billion. Investment advisory fees increased 13% on higher market valuations, whilst investment banking fees surged 35% as corporates returned to the debt and equity capital markets. Markets revenue grew 24%, supported by venture capital gains. Every business segment contributed to growth, with CIB revenue up 16%, WIM growing 13% with client assets reaching US$2.4 trillion, and both Consumer Banking and Commercial Banking expanding 6%. Non-interest income now represents 46% of total revenue, up from 44% previously. Balance Sheet Expansion Drives Net Interest Income For the first time in a decade, Wells Fargo achieved double-digit balance sheet growth. Average loans expanded 12% year-on-year to US$1.03 trillion, whilst deposits grew by 10% to US$1.47 trillion. This growth occurred across both consumer and commercial businesses, with CIB average loans rising 26% as the bank redeployed capacity freed by the asset cap removal. Net interest income rose 5% year-on-year to US$12.3 billion, marking the fourth consecutive quarter of growth. The bank maintained full-year NII guidance of approximately US$50 billion, with management indicating stronger growth expected in the second half. Research Recommendation Phillip Securities Research maintains a BUY rating with a higher target price of US$115, raised from US$98 previously. The upgrade reflects increased earnings estimates driven by higher NII, investment advisory, brokerage and investment banking forecasts, alongside lower provision estimates. The bank remains the top pick among major banks, offering unique growth opportunities through post-asset cap expansion at attractive valuations of 10.3 times forward price-to-earnings versus 12 times to 14 times for peers. Frequently Asked Questions [market_journal_faq] This article has been auto-generated using PhillipGPT. It is based on a report by a Phillip Securities Research analyst. Disclaimer These commentaries are intended for general circulation and do not have regard to the specific investment objectives, financial situation and particular needs of any person. Accordingly, no warranty whatsoever is given and no liability whatsoever is accepted for any loss arising whether directly or indirectly as a result of any person acting based on this information. You should seek advice from a financial adviser regarding the suitability of any investment product(s) mentioned herein, taking into account your specific investment objectives, financial situation or particular needs, before making a commitment to invest in such products. Opinions expressed in these commentaries are subject to change without notice. Investments are subject to investment risks including the possible loss of the principal amount invested. The value of units in any fund and the income from them may fall as well as rise. Past performance figures as well as any projection or forecast used in these commentaries are not necessarily indicative of future or likely performance. Phillip Securities Pte Ltd (PSPL), its directors, connected persons or employees may from time to time have an interest in the financial instruments mentioned in these commentaries. The information contained in these commentaries has been obtained from public sources which PSPL has no reason to believe are unreliable and any analysis, forecasts, projections, expectations and opinions (collectively the “Research”) contained in these commentaries are based on such information and are expressions of belief only. PSPL has not verified this information and no representation or warranty, express or implied, is made that such information or Research is accurate, complete or verified or should be relied upon as such. Any such information or Research contained in these commentaries are subject to change, and PSPL shall not have any responsibility to maintain the information or Research made available or to supply any corrections, updates or releases in connection therewith. In no event will PSPL be liable for any special, indirect, incidental or consequential damages which may be incurred from the use of the information or Research made available, even if it has been advised of the possibility of such damages. The companies and their employees mentioned in these commentaries cannot be held liable for any errors, inaccuracies and/or omissions howsoever caused. Any opinion or advice herein is made on a general basis and is subject to change without notice. The information provided in these commentaries may contain optimistic statements regarding future events or future financial performance of countries, markets or companies. You must make your own financial assessment of the relevance, accuracy and adequacy of the information provided in these commentaries. Views and any strategies described in these commentaries may not be suitable for all investors. Opinions expressed herein may differ from the opinions expressed by other units of PSPL or its connected persons and associates. Any reference to or discussion of investment products or commodities in these commentaries is purely for illustrative purposes only and must not be construed as a recommendation, an offer or solicitation for the subscription, purchase or sale of the investment products or commodities mentioned. This advertisement has not been reviewed by the Monetary Authority of Singapore.

Market Performance and Key Concerns The Magnificent 7 technology stocks experienced a significant pullback in June 2026, declining 8.5% compared to May's positive 5.4% performance. This sharp reversal saw the group substantially underperform both the S&P 500, which fell 1.1%, and the NASDAQ, which declined 2.8%. The decline was primarily driven by investor concerns over the substantial artificial intelligence spending commitments from major hyperscalers, including Microsoft (-17%), Meta (-11%), Amazon (-12%), and Google (-6%). These concerns were amplified by the four hyperscalers raising approximately US$139 billion in bonds during the first half of 2026, representing a 35% increase from their total bond issuances in 2025. Additional uncertainty emerged following the appointment of new Federal Reserve Chair Kevin Warsh in May, raising speculation about potential interest rate increases that could elevate AI financing costs. Individual Stock Performance Microsoft emerged as the biggest laggard, falling 17% after providing aggressive capital expenditure guidance of US$190 billion for fiscal year 2026, which exceeded consensus estimates of US$155 billion by 23%. This increase was attributed to higher-than-expected component prices driven by surging memory costs. Meta declined 11% amid reports that the company was considering raising tens of billions in equity funding to support its capital expenditure plans. Fundamental Demand Remains Strong Despite market concerns, research indicates that hyperscaler capital expenditure decisions are fundamentally sound, driven by genuine organic demand rather than speculative supply planning. The combined first quarter 2026 backlog for Microsoft, Google, and Amazon increased 46% year-over-year to US$873 billion, excluding deals with Anthropic and OpenAI. These partnerships, estimated at US$580 billion, are excluded from organic growth calculations due to their long-term nature of more than five years and associated execution and funding risks. The US$873 billion organic backlog serves as a reliable indicator of short-to-medium term AI demand from enterprises and sovereign nations, with the majority expected to be recognised within the next two years. Google noted that cloud revenue could have been higher if capacity constraints hadn't limited its ability to meet enterprise demand, whilst Amazon's Trainium chips are nearly fully subscribed and Microsoft anticipates capacity constraints continuing through 2026. Investment Outlook The research maintains an overweight recommendation on the Magnificent 7, noting that June's pullback reduced forward price-to-earnings valuations to 38.4 times from May's 39.7 times. The underperformance reflects broader investor rotation away from mega-cap technology stocks with high AI spending towards more attractively valued defensive sector names. Frequently Asked Questions [market_journal_faq] This article has been auto-generated using PhillipGPT. It is based on a report by a Phillip Securities Research analyst. Disclaimer These commentaries are intended for general circulation and do not have regard to the specific investment objectives, financial situation and particular needs of any person. Accordingly, no warranty whatsoever is given and no liability whatsoever is accepted for any loss arising whether directly or indirectly as a result of any person acting based on this information. You should seek advice from a financial adviser regarding the suitability of any investment product(s) mentioned herein, taking into account your specific investment objectives, financial situation or particular needs, before making a commitment to invest in such products. Opinions expressed in these commentaries are subject to change without notice. Investments are subject to investment risks including the possible loss of the principal amount invested. The value of units in any fund and the income from them may fall as well as rise. Past performance figures as well as any projection or forecast used in these commentaries are not necessarily indicative of future or likely performance. Phillip Securities Pte Ltd (PSPL), its directors, connected persons or employees may from time to time have an interest in the financial instruments mentioned in these commentaries. The information contained in these commentaries has been obtained from public sources which PSPL has no reason to believe are unreliable and any analysis, forecasts, projections, expectations and opinions (collectively the “Research”) contained in these commentaries are based on such information and are expressions of belief only. PSPL has not verified this information and no representation or warranty, express or implied, is made that such information or Research is accurate, complete or verified or should be relied upon as such. Any such information or Research contained in these commentaries are subject to change, and PSPL shall not have any responsibility to maintain the information or Research made available or to supply any corrections, updates or releases in connection therewith. In no event will PSPL be liable for any special, indirect, incidental or consequential damages which may be incurred from the use of the information or Research made available, even if it has been advised of the possibility of such damages. The companies and their employees mentioned in these commentaries cannot be held liable for any errors, inaccuracies and/or omissions howsoever caused. Any opinion or advice herein is made on a general basis and is subject to change without notice. The information provided in these commentaries may contain optimistic statements regarding future events or future financial performance of countries, markets or companies. You must make your own financial assessment of the relevance, accuracy and adequacy of the information provided in these commentaries. Views and any strategies described in these commentaries may not be suitable for all investors. Opinions expressed herein may differ from the opinions expressed by other units of PSPL or its connected persons and associates. Any reference to or discussion of investment products or commodities in these commentaries is purely for illustrative purposes only and must not be construed as a recommendation, an offer or solicitation for the subscription, purchase or sale of the investment products or commodities mentioned. This advertisement has not been reviewed by the Monetary Authority of Singapore.

Singapore Catalist Board IPOs Outperform Mainboard; US Mega-Cap Strategy Favours Short-Term Trading
Singapore IPO Performance Reveals a Market Divide Recent analysis of Singapore's initial public offering (IPO) landscape reveals a stark performance disparity between the Mainboard and Catalist Board listings, with significant implications for investors seeking exposure to newly listed companies. Singapore Mainboard IPOs have delivered disappointing results, generating an average first-day return of -2%. This lacklustre performance is further highlighted by the fact that only one-third of IPOs managed to close above their IPO price on their debut trading day. Catalist Board Emerges as the Superior Option In contrast, Singapore's Catalist Board listings present a markedly different proposition for investors. These smaller-cap offerings have delivered reliable double-digit gains on their opening day, averaging an impressive 19.8%. The sustained post-listing gains further enhance the risk-reward profile for short-term IPO speculation. The Catalist Board's average performance across various timeframes demonstrates consistent strength, with 50.5% returns after one week, 54.3% after one month, 88.3% after three months, and 114.4% after six months. US IPO Strategy Recommendations For major US IPOs, the optimal approach differs significantly from the strategies used in Singapore. Large US offerings typically generate strong opening day momentum, averaging gains of 16%. However, the recommended strategy involves riding the initial one-week to one-month momentum wave before exiting positions ahead of lock-up expirations. Importantly, historical data suggests that buying and holding mega-cap IPOs through their first year has proven to be a value-destructive proposition, making timing crucial for US IPO investments. The analysis indicates that traders seeking short-term IPO speculation should favour Singapore's Catalist Board offerings over Mainboard listings, whilst US IPO strategies should focus on capturing initial momentum rather than long-term holding. Frequently Asked Questions [market_journal_faq] This article has been auto-generated using PhillipGPT. It is based on a report by a Phillip Securities Research analyst. Disclaimer These commentaries are intended for general circulation and do not have regard to the specific investment objectives, financial situation and particular needs of any person. Accordingly, no warranty whatsoever is given and no liability whatsoever is accepted for any loss arising whether directly or indirectly as a result of any person acting based on this information. You should seek advice from a financial adviser regarding the suitability of any investment product(s) mentioned herein, taking into account your specific investment objectives, financial situation or particular needs, before making a commitment to invest in such products. Opinions expressed in these commentaries are subject to change without notice. Investments are subject to investment risks including the possible loss of the principal amount invested. The value of units in any fund and the income from them may fall as well as rise. Past performance figures as well as any projection or forecast used in these commentaries are not necessarily indicative of future or likely performance. Phillip Securities Pte Ltd (PSPL), its directors, connected persons or employees may from time to time have an interest in the financial instruments mentioned in these commentaries. The information contained in these commentaries has been obtained from public sources which PSPL has no reason to believe are unreliable and any analysis, forecasts, projections, expectations and opinions (collectively the “Research”) contained in these commentaries are based on such information and are expressions of belief only. PSPL has not verified this information and no representation or warranty, express or implied, is made that such information or Research is accurate, complete or verified or should be relied upon as such. Any such information or Research contained in these commentaries are subject to change, and PSPL shall not have any responsibility to maintain the information or Research made available or to supply any corrections, updates or releases in connection therewith. In no event will PSPL be liable for any special, indirect, incidental or consequential damages which may be incurred from the use of the information or Research made available, even if it has been advised of the possibility of such damages. The companies and their employees mentioned in these commentaries cannot be held liable for any errors, inaccuracies and/or omissions howsoever caused. Any opinion or advice herein is made on a general basis and is subject to change without notice. The information provided in these commentaries may contain optimistic statements regarding future events or future financial performance of countries, markets or companies. You must make your own financial assessment of the relevance, accuracy and adequacy of the information provided in these commentaries. Views and any strategies described in these commentaries may not be suitable for all investors. Opinions expressed herein may differ from the opinions expressed by other units of PSPL or its connected persons and associates. Any reference to or discussion of investment products or commodities in these commentaries is purely for illustrative purposes only and must not be construed as a recommendation, an offer or solicitation for the subscription, purchase or sale of the investment products or commodities mentioned. This advertisement has not been reviewed by the Monetary Authority of Singapore.

Singapore Banking Sector Upgraded to ACCUMULATE on Rising Loan Growth and Rate Stabilisation
Company Overview This analysis covers Singapore's major banking sector, focusing on the three primary banks: DBS, OCBC, and UOB. These institutions represent the core of Singapore's financial services landscape, serving both domestic and regional markets whilst benefiting from the city-state's position as a financial hub. Upgrade to ACCUMULATE Rating Phillip Securities Research has upgraded the Singapore banking sector to ACCUMULATE from Neutral, driven by accelerating loan growth, stabilising interest rates, and improved market conditions. The research house has raised target prices across all three major banks: DBS to S$76.00 from S$67.50, OCBC to S$28.50 from S$24.00, and UOB to S$43.00 from S$39.00, reflecting higher loan growth and earnings estimates. Interest Rate Environment Stabilising Singapore's 3-month SORA rose for the second consecutive month, increasing 1 basis point month-on-month to 1.07% in June. This represents the smallest year-on-year decline in 15 months at 109 basis points, suggesting that rates are beginning to bottom out. The stabilisation reflects the Federal Reserve's increasingly hawkish stance, with June projections signalling a possible rate hike and no cuts anticipated, creating a supportive backdrop for net interest margins. Strong Loan Growth and Deposit Trends Singapore loan growth continued its surge at 8.7% year-on-year, potentially leading to upward revisions to previous guidance to low- to mid-single digit growth. Current account and savings account (CASA) deposits rose 15% year-on-year, with the CASA deposits ratio improving to 20.7% from 20.5% in April, reaching the highest level since November 2022. This trend provides a tailwind for banks by lowering funding costs and cushioning net interest margin compression. Market Volatility Benefits Ongoing geopolitical tensions, including the collapsed US-Iran ceasefire and renewed strikes lifting oil prices, continue to generate market volatility. This environment benefits capital markets income and wealth management fees, providing meaningful offsets to net interest income headwinds. The sector offers attractive dividend yields of 4.1%, with ongoing share buybacks improving return on equity. DBS is preferred for its fixed dividend policy and guidance upgrade, whilst OCBC is favoured for wealth management growth and excess capital. Frequently Asked Questions [market_journal_faq] This article has been auto-generated using PhillipGPT. It is based on a report by a Phillip Securities Research analyst. Disclaimer These commentaries are intended for general circulation and do not have regard to the specific investment objectives, financial situation and particular needs of any person. Accordingly, no warranty whatsoever is given and no liability whatsoever is accepted for any loss arising whether directly or indirectly as a result of any person acting based on this information. You should seek advice from a financial adviser regarding the suitability of any investment product(s) mentioned herein, taking into account your specific investment objectives, financial situation or particular needs, before making a commitment to invest in such products. Opinions expressed in these commentaries are subject to change without notice. Investments are subject to investment risks including the possible loss of the principal amount invested. The value of units in any fund and the income from them may fall as well as rise. Past performance figures as well as any projection or forecast used in these commentaries are not necessarily indicative of future or likely performance. Phillip Securities Pte Ltd (PSPL), its directors, connected persons or employees may from time to time have an interest in the financial instruments mentioned in these commentaries. The information contained in these commentaries has been obtained from public sources which PSPL has no reason to believe are unreliable and any analysis, forecasts, projections, expectations and opinions (collectively the “Research”) contained in these commentaries are based on such information and are expressions of belief only. PSPL has not verified this information and no representation or warranty, express or implied, is made that such information or Research is accurate, complete or verified or should be relied upon as such. Any such information or Research contained in these commentaries are subject to change, and PSPL shall not have any responsibility to maintain the information or Research made available or to supply any corrections, updates or releases in connection therewith. In no event will PSPL be liable for any special, indirect, incidental or consequential damages which may be incurred from the use of the information or Research made available, even if it has been advised of the possibility of such damages. The companies and their employees mentioned in these commentaries cannot be held liable for any errors, inaccuracies and/or omissions howsoever caused. Any opinion or advice herein is made on a general basis and is subject to change without notice. The information provided in these commentaries may contain optimistic statements regarding future events or future financial performance of countries, markets or companies. You must make your own financial assessment of the relevance, accuracy and adequacy of the information provided in these commentaries. Views and any strategies described in these commentaries may not be suitable for all investors. Opinions expressed herein may differ from the opinions expressed by other units of PSPL or its connected persons and associates. Any reference to or discussion of investment products or commodities in these commentaries is purely for illustrative purposes only and must not be construed as a recommendation, an offer or solicitation for the subscription, purchase or sale of the investment products or commodities mentioned. This advertisement has not been reviewed by the Monetary Authority of Singapore.

Strategic Acquisitions Drive Growth Q & M Dental Group Ltd has announced significant expansion plans through two major acquisitions that will substantially increase its regional footprint. The Singapore-based dental services provider is acquiring a 100% stake in Australia's Experteeth Dental Group and a 51% stake in Thailand's Deezy Dental Home for approximately S$107 million and S$39 million respectively. Company Profile Q & M Dental Group operates as a comprehensive dental services provider across the Asia-Pacific region. The company has established itself as a regional healthcare player in the healthcare sector, focusing on dental care services and clinic operations across multiple markets. Acquisition Details and Financing Structure The combined S$146 million purchase will be financed through S$92 million in cash and the issuance of 86.7 million new shares, representing 9.1% of existing shares. The new shares are priced at S$0.70 each and will be subject to a 15-year moratorium, ensuring long-term commitment from the vendors. The Australian acquisition targets Experteeth Dental Group, founded in 2017, which operates 40 dental clinics with 117 dentists across New South Wales, Victoria, Queensland, Tasmania, and the Australian Capital Territory. The group operates under multiple established brands including Elevate Dental Group, Lumiere Dental Group, Ace Dental Group, Yiruda Dental Group, Prestige Dental Group, and Bubble Teeth Dental Group. The Thai acquisition involves Deezy Dental Home, also founded in 2017, which operates three dental clinics with 41 dentists. Strong Financial Backing and Growth Prospects The acquisitions are valued at an attractive price-to-earnings ratio of 11.4 times, with the Australian operation at 10 times and the Thai operation at 16 times. Importantly, the total S$146 million investment is supported by robust profit guarantees totalling S$126 million over six to eight years. This arrangement implies earnings growth of approximately 13%, with Thailand showing the highest growth potential at 22% compound annual growth rate. Analyst Outlook Phillip Securities Research maintains a positive outlook on these acquisitions, projecting that they could increase FY26 earnings per share by 1.04 cents, representing a 54% increase to 2.96 cents, excluding intangible amortisation. The research house maintains its BUY recommendation with an unchanged target price of S$0.71, based on price-to-earnings ratio of 25 times for FY26, aligned with Singapore's healthcare sector valuation. Frequently Asked Questions [market_journal_faq] This article has been auto-generated using PhillipGPT. It is based on a report by a Phillip Securities Research analyst. Disclaimer These commentaries are intended for general circulation and do not have regard to the specific investment objectives, financial situation and particular needs of any person. Accordingly, no warranty whatsoever is given and no liability whatsoever is accepted for any loss arising whether directly or indirectly as a result of any person acting based on this information. You should seek advice from a financial adviser regarding the suitability of any investment product(s) mentioned herein, taking into account your specific investment objectives, financial situation or particular needs, before making a commitment to invest in such products. Opinions expressed in these commentaries are subject to change without notice. Investments are subject to investment risks including the possible loss of the principal amount invested. The value of units in any fund and the income from them may fall as well as rise. Past performance figures as well as any projection or forecast used in these commentaries are not necessarily indicative of future or likely performance. Phillip Securities Pte Ltd (PSPL), its directors, connected persons or employees may from time to time have an interest in the financial instruments mentioned in these commentaries. The information contained in these commentaries has been obtained from public sources which PSPL has no reason to believe are unreliable and any analysis, forecasts, projections, expectations and opinions (collectively the “Research”) contained in these commentaries are based on such information and are expressions of belief only. PSPL has not verified this information and no representation or warranty, express or implied, is made that such information or Research is accurate, complete or verified or should be relied upon as such. Any such information or Research contained in these commentaries are subject to change, and PSPL shall not have any responsibility to maintain the information or Research made available or to supply any corrections, updates or releases in connection therewith. In no event will PSPL be liable for any special, indirect, incidental or consequential damages which may be incurred from the use of the information or Research made available, even if it has been advised of the possibility of such damages. The companies and their employees mentioned in these commentaries cannot be held liable for any errors, inaccuracies and/or omissions howsoever caused. Any opinion or advice herein is made on a general basis and is subject to change without notice. The information provided in these commentaries may contain optimistic statements regarding future events or future financial performance of countries, markets or companies. You must make your own financial assessment of the relevance, accuracy and adequacy of the information provided in these commentaries. Views and any strategies described in these commentaries may not be suitable for all investors. Opinions expressed herein may differ from the opinions expressed by other units of PSPL or its connected persons and associates. Any reference to or discussion of investment products or commodities in these commentaries is purely for illustrative purposes only and must not be construed as a recommendation, an offer or solicitation for the subscription, purchase or sale of the investment products or commodities mentioned. This advertisement has not been reviewed by the Monetary Authority of Singapore.

Semiconductor Sector Sustains Strong Growth Momentum with Accelerating Revenue Expansion
Sector Performance Driven by Memory Boom and AI Infrastructure Demand The semiconductor sector continues to demonstrate robust growth momentum, with the Semiconductor ETF surging 39.9% over the past three months, significantly outperforming the S&P 500's 11.4% gain. Memory companies have emerged as the standout performers, posting exceptional gains of 95% driven by extraordinary first-quarter 2026 earnings growth exceeding 900% year-on-year. This remarkable performance stems from a substantial surge in DRAM and NAND prices amid widespread memory chip shortages. Extended Supply Contracts Signal Long-Term Industry Stability A notable shift in industry dynamics has emerged through the establishment of longer-term supply agreements. Hyperscalers and high-end chipmakers are now committing to multi-year contracts extending until 2030, representing a significant departure from previous agreements that typically lasted only one year with flexible financing terms. These new arrangements require approximately 20% cash deposits to secure supply, demonstrating the critical importance of memory chips in AI data centre buildouts. Equipment manufacturers report that these extended memory contracts provide enhanced supply chain visibility extending through the end of 2027. Processor Segment Shows Accelerating Growth Trajectory The processor segment continues its growth acceleration, with first-quarter 2026 revenue surging 53% year-on-year, up from 40% growth in the fourth quarter of 2025. This momentum is expected to continue, with second-quarter 2026 revenue guidance indicating a substantial 67% year-on-year increase to US$159 billion. The growth is underpinned by robust hyperscaler demand for data centre GPUs, CPUs, and ASICs. NVIDIA leads the sector with first-quarter revenue spiking 85% year-on-year to US$81.6 billion, marking the third consecutive quarter of accelerating growth. AMD demonstrated its strongest year-on-year growth since 2022, with revenue increasing 38% to US$10.3 billion, driven by MI350 GPU and fifth-generation EPYC CPU adoption. Broadcom achieved its strongest growth since 2016, with revenue rising 48% year-on-year to US$22.2 billion, supported by AI semiconductor revenue that grew 143% year-on-year to a record US$10.8 billion. The sector maintains strong forward momentum, supported by hyperscalers' combined 2026 capital expenditure guidance of US$710 billion, representing an 89% year-on-year increase. Equipment players continue to benefit from strong services demand as memory customers seek performance upgrades on existing tools due to limited cleanroom space. Frequently Asked Questions [market_journal_faq] This article has been auto-generated using PhillipGPT. It is based on a report by a Phillip Securities Research analyst. Disclaimer These commentaries are intended for general circulation and do not have regard to the specific investment objectives, financial situation and particular needs of any person. Accordingly, no warranty whatsoever is given and no liability whatsoever is accepted for any loss arising whether directly or indirectly as a result of any person acting based on this information. You should seek advice from a financial adviser regarding the suitability of any investment product(s) mentioned herein, taking into account your specific investment objectives, financial situation or particular needs, before making a commitment to invest in such products. Opinions expressed in these commentaries are subject to change without notice. Investments are subject to investment risks including the possible loss of the principal amount invested. The value of units in any fund and the income from them may fall as well as rise. Past performance figures as well as any projection or forecast used in these commentaries are not necessarily indicative of future or likely performance. Phillip Securities Pte Ltd (PSPL), its directors, connected persons or employees may from time to time have an interest in the financial instruments mentioned in these commentaries. The information contained in these commentaries has been obtained from public sources which PSPL has no reason to believe are unreliable and any analysis, forecasts, projections, expectations and opinions (collectively the “Research”) contained in these commentaries are based on such information and are expressions of belief only. PSPL has not verified this information and no representation or warranty, express or implied, is made that such information or Research is accurate, complete or verified or should be relied upon as such. Any such information or Research contained in these commentaries are subject to change, and PSPL shall not have any responsibility to maintain the information or Research made available or to supply any corrections, updates or releases in connection therewith. In no event will PSPL be liable for any special, indirect, incidental or consequential damages which may be incurred from the use of the information or Research made available, even if it has been advised of the possibility of such damages. The companies and their employees mentioned in these commentaries cannot be held liable for any errors, inaccuracies and/or omissions howsoever caused. Any opinion or advice herein is made on a general basis and is subject to change without notice. The information provided in these commentaries may contain optimistic statements regarding future events or future financial performance of countries, markets or companies. You must make your own financial assessment of the relevance, accuracy and adequacy of the information provided in these commentaries. Views and any strategies described in these commentaries may not be suitable for all investors. Opinions expressed herein may differ from the opinions expressed by other units of PSPL or its connected persons and associates. Any reference to or discussion of investment products or commodities in these commentaries is purely for illustrative purposes only and must not be construed as a recommendation, an offer or solicitation for the subscription, purchase or sale of the investment products or commodities mentioned. This advertisement has not been reviewed by the Monetary Authority of Singapore.


