Quantitative easing
Table of Contents
Quantitative easing
To boost the amount of money in circulation and promote bank lending and investment, a central bank, such as the US Federal Reserve, may engage in a practice known as “quantitative easing,”, or QE, in which it acquires securities via open market operations. Globally, quantitative easing policies have been implemented, but it’s not always clear how they affect a nation’s economy.
Here we provide a comprehensive view of quantitative easing.
What is QE?
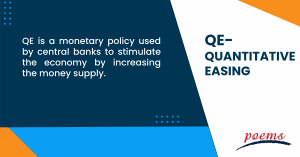
QE is a monetary policy used by central banks to stimulate the economy by increasing the money supply. This policy is usually used when interest rates are at or near zero, and traditional monetary policy tools are no longer effective.
The US treasury department may produce new funds and enact new tax laws via fiscal policy, delivering money directly or indirectly into the economy. In contrast, the Federal Reserve can affect the amount of money in the economy. Financial and monetary policy may be combined in quantitative easing.
How does QE easing work?
QE is an unconventional monetary policy in which a central bank purchases government securities or other securities from the market to increase the money supply and encourage lending and investment. The goal of QE is to lower interest rates and increase the money supply in an economy when conventional monetary policy has failed.
QE is a controversial policy, but it is not without risks. One of the risks is that it can lead to inflation if the central bank creates too much money. Another risk is that it can lead to asset bubbles if the money is used to purchase assets such as stocks or real estate.
When is QE used?
QE is frequently used when interest rates are close to zero, and the economy remains static. Then, methods available to central banks to affect economic development are restricted, such as lowering interest rates. So, to strategically raise the money supply, central banks must be unable to reduce interest rates further.
As a result, the central bank then creates new money to purchase government securities or other assets from banks and other financial institutions. And this increases the money supply and encourages lending and investment.
Risks of QE
While QE can effectively stimulate economic growth, it also carries some risks.
- One of the main risks is that it can lead to inflation. If the money supply is increased too much, prices for goods and services will start to rise, which can erode the purchasing power of consumers.
- Another risk is that QE can cause asset bubbles. When asset prices (such as stocks or real estate) are artificially inflated by QE, it can lead to unsustainable prices that eventually collapse, causing economic hardship.
- Finally, QE can potentially increase the risk of moral hazard. Moral hazard occurs when people take on more risk than they would otherwise because they believe they will be bailed out if things go wrong. This can lead to even more reckless behavior and further economic problems.
While QE is a powerful tool that can help boost the economy, it is important to be aware of the risks involved. Central banks need to be careful not to overdo it with QE, as that can lead to more problems than it solves.
What are the downsides of QE?
While QE can be effective in spurring economic growth, it also has some potential downsides that central banks should be aware of.
- For one, QE can cause inflationary pressures if the money supply is increased too rapidly. This can lead to higher prices for goods and services, which can be detrimental to economic growth.
- Additionally, QE can also distort financial markets and lead to asset bubbles. If asset prices get too far out of line with underlying fundamentals, it can lead to a sharp market correction, negatively affecting the economy.
Thus, while QE is a useful policy tool, central banks should be aware of its potential downsides and take steps to mitigate them.
Frequently Asked Questions
Balance sheet normalisation, commonly referred to as quantitative tightening, is a monetary policy practiced by central banks. It simply implies that a central bank adopts a monetary policy opposite to QE, slowing down the speed at which revenues from expiring government bonds are reinvested.
There is one major difference between QE and quantitative tightening. QE is when a central bank buys government bonds or other financial assets to inject money into the economy, while quantitative tightening is when a central bank sells government bonds or other financial assets to reduce the money supply
QE and open market operations are tools used by the Federal Reserve to influence the economy. QE is when the Fed buys bonds from banks and other financial institutions to increase the money supply and lower interest rates. Open market operations are when the Fed buys and sells government securities in order to influence the level of bank reserves and the money supply.
QE is extremely effective. Through QE, central banks can significantly expand the size of their balance sheets, raising the quantity of credit accessible to borrowers. A central bank issues fresh currency and uses it to buy assets from commercial banks in order to make that happen.
Quantitative easing can help boost economic activity by making it easier for businesses to borrow money and increasing the money available to consumers. This can lead to higher inflation, which can benefit businesses as it can increase demand for their goods and services. However, too much QE can lead to inflationary pressures and asset bubbles.
Overall, QE can be a helpful tool for stimulating the economy, but it needs to be used carefully to avoid creating inflationary pressures.
Related Terms
- Investment adviser public disclosure
- Price-to-Book Ratio
- Investment adviser registration depository
- Contingent deferred sales charges
- Net asset value (NAV)
- CAGR
- Mark-to-market
- Federal Open Market Committee
- FIRE
- Applicable federal rate
- Automated teller machine
- Central limit theorem
- Balanced scorecard
- Analysis of variance
- Annual Percentage rate
- Investment adviser public disclosure
- Price-to-Book Ratio
- Investment adviser registration depository
- Contingent deferred sales charges
- Net asset value (NAV)
- CAGR
- Mark-to-market
- Federal Open Market Committee
- FIRE
- Applicable federal rate
- Automated teller machine
- Central limit theorem
- Balanced scorecard
- Analysis of variance
- Annual Percentage rate
- Double Taxation Agreement
- Floating Rate Notes
- Average True Range (ATR)
- Constant maturity treasury
- Employee stock option
- Hysteresis
- RevPAR
- REITS
- General and administrative expenses
- OPEX
- ARPU
- WACC
- DCF
- NPL
- Capital expenditure (Capex)
- Balance of trade (BOT)
- Retail price index (RPI)
- Unit investment trust (UIT)
- SPAC
- GAAP
- GDPR
- GATT
- Irrevocable Trust
- Line of credit
- Coefficient of Variation (CV)
- Creative Destruction (CD)
- Letter of credits (LC)
- Statement of additional information
- Year to date
- Certificate of deposit
- Price-to-earnings (P/E) ratio
- Individual retirement account (IRA)
- Yield to maturity
- Rights of accumulation (ROA)
- Letter of Intent
- Return on Invested Capital (ROIC)
- Return on Equity (ROE)
- Return on Assets (ROA)
Most Popular Terms
Other Terms
- Bond Convexity
- Compound Yield
- Brokerage Account
- Discretionary Accounts
- Industry Groups
- Growth Rate
- Green Bond Principles
- Gamma Scalping
- Funding Ratio
- Free-Float Methodology
- Foreign Direct Investment (FDI)
- Floating Dividend Rate
- Flight to Quality
- Real Return
- Protective Put
- Perpetual Bond
- Option Adjusted Spread (OAS)
- Non-Diversifiable Risk
- Merger Arbitrage
- Liability-Driven Investment (LDI)
- Income Bonds
- Guaranteed Investment Contract (GIC)
- Flash Crash
- Equity Carve-Outs
- Cost of Equity
- Cost Basis
- Deferred Annuity
- Cash-on-Cash Return
- Earning Surprise
- Capital Adequacy Ratio (CAR)
- Bubble
- Beta Risk
- Bear Spread
- Asset Play
- Accrued Market Discount
- Ladder Strategy
- Junk Status
- Intrinsic Value of Stock
- Interest-Only Bonds (IO)
- Interest Coverage Ratio
- Inflation Hedge
- Industry Groups
- Incremental Yield
- Industrial Bonds
- Income Statement
- Holding Period Return
- Historical Volatility (HV)
- Hedge Effectiveness
- Flat Yield Curve
- Fallen Angel
Know More about
Tools/Educational Resources
Markets Offered by POEMS
Read the Latest Market Journal

Gold in 2026: Why Analysts Believe the Rally May Continue
Gold has emerged as one of the strongest-performing major asset classes, attracting investors seeking portfolio diversification and protection against economic uncertainty. After delivering exceptional returns in 2025, many market analysts continue to see upside potential for gold in 2026. Gold at a Glance Metric Value Spot Gold Price (11 June 2026) US$4,073/oz 2026 Peak Price US$5,595/oz J.P. Morgan Bull Case Target US$6,300/oz 2025 Return +60% These figures illustrate why gold remains one of the most discussed asset classes among investors. Ways to Invest in Gold Investors can gain exposure to gold through several investment vehicles, each offering different benefits and risks. Investment Type Suitable For Key Benefits Physical Gold Long-term holders Direct ownership Gold ETFs Most retail investors Low cost, easy trading Mining Stocks Growth investors Potentially higher returns Futures & CFDs Experienced traders Leveraged exposure Why Many Investors Prefer Gold ETFs Gold ETFs have become one of the easiest ways to invest in gold because they offer exposure to the price of gold without the need to buy, store, or insure physical bullion. The infographic compares US-listed Gold ETFs and highlights their management fees and fund sizes. The Investment Case for Gold Gold has historically been viewed as both a defensive asset and a portfolio diversifier. During periods of inflation, geopolitical uncertainty, or financial market volatility, investors often increase their allocations to gold. Why Investors Consider Gold Acts as a hedge against inflation Diversifies investment portfolios Preserves purchasing power over time Can perform well during market uncertainty Offers high global liquidity Should You Buy Physical Gold or Gold ETFs? For most retail investors, Gold ETFs offer several advantages: Feature Physical Gold Gold ETF Storage Required Yes No Easy to Trade Limited Yes Brokerage Account No Yes Liquidity Moderate High Ongoing Costs Storage & Insurance Management Fee Frequently Asked Questions [market_journal_faq] Disclaimer These commentaries are intended for general circulation and do not have regard to the specific investment objectives, financial situation and particular needs of any person. Accordingly, no warranty whatsoever is given and no liability whatsoever is accepted for any loss arising whether directly or indirectly as a result of any person acting based on this information. You should seek advice from a financial adviser regarding the suitability of any investment product(s) mentioned herein, taking into account your specific investment objectives, financial situation or particular needs, before making a commitment to invest in such products. Opinions expressed in these commentaries are subject to change without notice. Investments are subject to investment risks including the possible loss of the principal amount invested. The value of units in any fund and the income from them may fall as well as rise. Past performance figures as well as any projection or forecast used in these commentaries are not necessarily indicative of future or likely performance. Phillip Securities Pte Ltd (PSPL), its directors, connected persons or employees may from time to time have an interest in the financial instruments mentioned in these commentaries. The information contained in these commentaries has been obtained from public sources which PSPL has no reason to believe are unreliable and any analysis, forecasts, projections, expectations and opinions (collectively the “Research”) contained in these commentaries are based on such information and are expressions of belief only. PSPL has not verified this information and no representation or warranty, express or implied, is made that such information or Research is accurate, complete or verified or should be relied upon as such. Any such information or Research contained in these commentaries are subject to change, and PSPL shall not have any responsibility to maintain the information or Research made available or to supply any corrections, updates or releases in connection therewith. In no event will PSPL be liable for any special, indirect, incidental or consequential damages which may be incurred from the use of the information or Research made available, even if it has been advised of the possibility of such damages. The companies and their employees mentioned in these commentaries cannot be held liable for any errors, inaccuracies and/or omissions howsoever caused. Any opinion or advice herein is made on a general basis and is subject to change without notice. The information provided in these commentaries may contain optimistic statements regarding future events or future financial performance of countries, markets or companies. You must make your own financial assessment of the relevance, accuracy and adequacy of the information provided in these commentaries. Views and any strategies described in these commentaries may not be suitable for all investors. Opinions expressed herein may differ from the opinions expressed by other units of PSPL or its connected persons and associates. Any reference to or discussion of investment products or commodities in these commentaries is purely for illustrative purposes only and must not be construed as a recommendation, an offer or solicitation for the subscription, purchase or sale of the investment products or commodities mentioned. This advertisement has not been reviewed by the Monetary Authority of Singapore.

Singapore Equities Show Strong Momentum as AI Cycle Drives Growth, Banks and Semiconductors Favoured
Market Performance and Outlook Singapore equities have demonstrated robust performance, posting their fourth consecutive quarter of gains with a 5.8% rise in 2Q26. The market reached record highs on 25th June and was up 11.3% for the first half of 2026. The ceasefire in the Middle East has particularly benefited transportation stocks, whilst increased volatility supported exchanges and banking shares. Expectations of bottoming interest rates have further rallied banking stocks, though energy-related equities have faced pressure from sluggish oil and gas capital expenditure and falling energy prices. AI Investment Cycle: Booming Not Bubbling Phillip Securities Research maintains that current market conditions do not constitute an AI bubble. The firm identifies several key factors supporting this view. Massive AI and data centre capital expenditure by hyperscalers, including Oracle and Meta, is expected to rise 73% in 2026 and 22% in 2027, cascading into substantial semiconductor purchases with billings rising 86% year-to-date to reach an annualised US$1 trillion . Wafer fabrication capital expenditure is projected to jump 40% year-on-year to US$175 billion. The driving force behind this spending stems from frontier AI models, particularly Anthropic and OpenAI, whose combined revenue could total US$85 billion this year. Under an S-curve growth trajectory, revenue is expected to reach US$300 billion by 2030, justifying the capital expenditure spike. Current technology sector valuations remain significantly below dot-com bubble levels, with Nvidia trading at 24 times price-to-earnings compared to Cisco's peak of 150 times forward price-to-earnings in 2000. Investment Strategy and Sector Preferences The research house favours banks, semiconductors, building materials, power, and higher-yielding REITs. Banking stocks benefit from resilient dividend yields of around 4% and loan growth surging towards 8% year-on-year, a four-year high. A major spike in deposits following the Middle East conflict, with March recording a S$66 billion jump compared to the prior five-year monthly average of S$9 billion , should help lower funding costs. Semiconductor stocks are expected to register the fastest growth, fuelled by record demand from key equipment customers including ASML, Applied Materials, and Lam Research. In construction, whilst order momentum has slowed, activity has increased, supporting a 29% rise in ready-mixed concrete demand. Frequently Asked Questions [market_journal_faq] This article has been auto-generated using PhillipGPT. It is based on a report by a Phillip Securities Research analyst. Disclaimer These commentaries are intended for general circulation and do not have regard to the specific investment objectives, financial situation and particular needs of any person. Accordingly, no warranty whatsoever is given and no liability whatsoever is accepted for any loss arising whether directly or indirectly as a result of any person acting based on this information. You should seek advice from a financial adviser regarding the suitability of any investment product(s) mentioned herein, taking into account your specific investment objectives, financial situation or particular needs, before making a commitment to invest in such products. Opinions expressed in these commentaries are subject to change without notice. Investments are subject to investment risks including the possible loss of the principal amount invested. The value of units in any fund and the income from them may fall as well as rise. Past performance figures as well as any projection or forecast used in these commentaries are not necessarily indicative of future or likely performance. Phillip Securities Pte Ltd (PSPL), its directors, connected persons or employees may from time to time have an interest in the financial instruments mentioned in these commentaries. The information contained in these commentaries has been obtained from public sources which PSPL has no reason to believe are unreliable and any analysis, forecasts, projections, expectations and opinions (collectively the “Research”) contained in these commentaries are based on such information and are expressions of belief only. PSPL has not verified this information and no representation or warranty, express or implied, is made that such information or Research is accurate, complete or verified or should be relied upon as such. Any such information or Research contained in these commentaries are subject to change, and PSPL shall not have any responsibility to maintain the information or Research made available or to supply any corrections, updates or releases in connection therewith. In no event will PSPL be liable for any special, indirect, incidental or consequential damages which may be incurred from the use of the information or Research made available, even if it has been advised of the possibility of such damages. The companies and their employees mentioned in these commentaries cannot be held liable for any errors, inaccuracies and/or omissions howsoever caused. Any opinion or advice herein is made on a general basis and is subject to change without notice. The information provided in these commentaries may contain optimistic statements regarding future events or future financial performance of countries, markets or companies. You must make your own financial assessment of the relevance, accuracy and adequacy of the information provided in these commentaries. Views and any strategies described in these commentaries may not be suitable for all investors. Opinions expressed herein may differ from the opinions expressed by other units of PSPL or its connected persons and associates. Any reference to or discussion of investment products or commodities in these commentaries is purely for illustrative purposes only and must not be construed as a recommendation, an offer or solicitation for the subscription, purchase or sale of the investment products or commodities mentioned. This advertisement has not been reviewed by the Monetary Authority of Singapore.

ETF Monthly Outlook: Sideways Consolidation Expected Across Most Asset Classes in July 2026
Market Overview and Performance Summary The ETF market landscape presents a mixed picture heading into July 2026, with most major asset classes expected to enter periods of sideways consolidation following varied performance in June. According to the latest monthly analysis, investors should prepare for range-bound trading across several key exchange-traded funds tracking major indices and commodities. Asset Class Performance Analysis Equities showed divergent trends during June, with the Vanguard S&P 500 ETF (VOO) ending two consecutive months of gains with a 0.9% decline. The fund is expected to extend its sideways consolidation from June into July as markets digest recent moves. In contrast, Singapore equities demonstrated strength, with the SPDR Singapore Equities ETF (ES3) posting its third consecutive monthly gain of 3% in June, though analysts expect consolidation after the ETF reached target levels. Fixed income markets remained relatively stable, with the iShares 7-10 Year Treasury Bond ETF (IEF) trading flat during June. The bond ETF is anticipated to remain range-bound between US$93.40 and US$95.40 in July, extending a sideways consolidation pattern that has persisted since mid-March. Commodities faced significant headwinds, particularly in the precious metals sector. The SPDR Gold MiniShares Trust (GLDM) recorded its fourth consecutive monthly decline, tumbling 11.6% in June. Despite this weakness, analysts expect sideways consolidation in July, with support likely to hold at US$77.50 should the price retest the swing low from October 2025. Energy sector weakness continued, with the SPDR S&P Oil & Gas Exploration & Production ETF (XOP) falling 5.4% in June, marking its third consecutive monthly decline. The ETF is expected to consolidate sideways in July, with support anticipated in the US$148 to US$154 area. Notable Underperformers The cryptocurrency space showed particular vulnerability, with the ProShares Bitcoin Strategy ETF (BITO) tumbling 20.2% in June, marking its second consecutive monthly decline. Unlike other asset classes, Bitcoin ETFs are expected to continue their bearish trend in July, potentially retesting the US$7.44 swing low from August 2024, representing a 6.7% downside from current levels. Asian markets also faced pressure, with the Hang Seng China Enterprises Index ETF (2828) declining 9.6% in June for its second consecutive monthly drop. However, sideways consolidation is expected, with support between HKD$74.65 and HKD$77.10. Frequently Asked Questions [market_journal_faq] This article has been auto-generated using PhillipGPT. It is based on a report by a Phillip Securities Research analyst. Disclaimer These commentaries are intended for general circulation and do not have regard to the specific investment objectives, financial situation and particular needs of any person. Accordingly, no warranty whatsoever is given and no liability whatsoever is accepted for any loss arising whether directly or indirectly as a result of any person acting based on this information. You should seek advice from a financial adviser regarding the suitability of any investment product(s) mentioned herein, taking into account your specific investment objectives, financial situation or particular needs, before making a commitment to invest in such products. Opinions expressed in these commentaries are subject to change without notice. Investments are subject to investment risks including the possible loss of the principal amount invested. The value of units in any fund and the income from them may fall as well as rise. Past performance figures as well as any projection or forecast used in these commentaries are not necessarily indicative of future or likely performance. Phillip Securities Pte Ltd (PSPL), its directors, connected persons or employees may from time to time have an interest in the financial instruments mentioned in these commentaries. The information contained in these commentaries has been obtained from public sources which PSPL has no reason to believe are unreliable and any analysis, forecasts, projections, expectations and opinions (collectively the “Research”) contained in these commentaries are based on such information and are expressions of belief only. PSPL has not verified this information and no representation or warranty, express or implied, is made that such information or Research is accurate, complete or verified or should be relied upon as such. Any such information or Research contained in these commentaries are subject to change, and PSPL shall not have any responsibility to maintain the information or Research made available or to supply any corrections, updates or releases in connection therewith. In no event will PSPL be liable for any special, indirect, incidental or consequential damages which may be incurred from the use of the information or Research made available, even if it has been advised of the possibility of such damages. The companies and their employees mentioned in these commentaries cannot be held liable for any errors, inaccuracies and/or omissions howsoever caused. Any opinion or advice herein is made on a general basis and is subject to change without notice. The information provided in these commentaries may contain optimistic statements regarding future events or future financial performance of countries, markets or companies. You must make your own financial assessment of the relevance, accuracy and adequacy of the information provided in these commentaries. Views and any strategies described in these commentaries may not be suitable for all investors. Opinions expressed herein may differ from the opinions expressed by other units of PSPL or its connected persons and associates. Any reference to or discussion of investment products or commodities in these commentaries is purely for illustrative purposes only and must not be construed as a recommendation, an offer or solicitation for the subscription, purchase or sale of the investment products or commodities mentioned. This advertisement has not been reviewed by the Monetary Authority of Singapore.
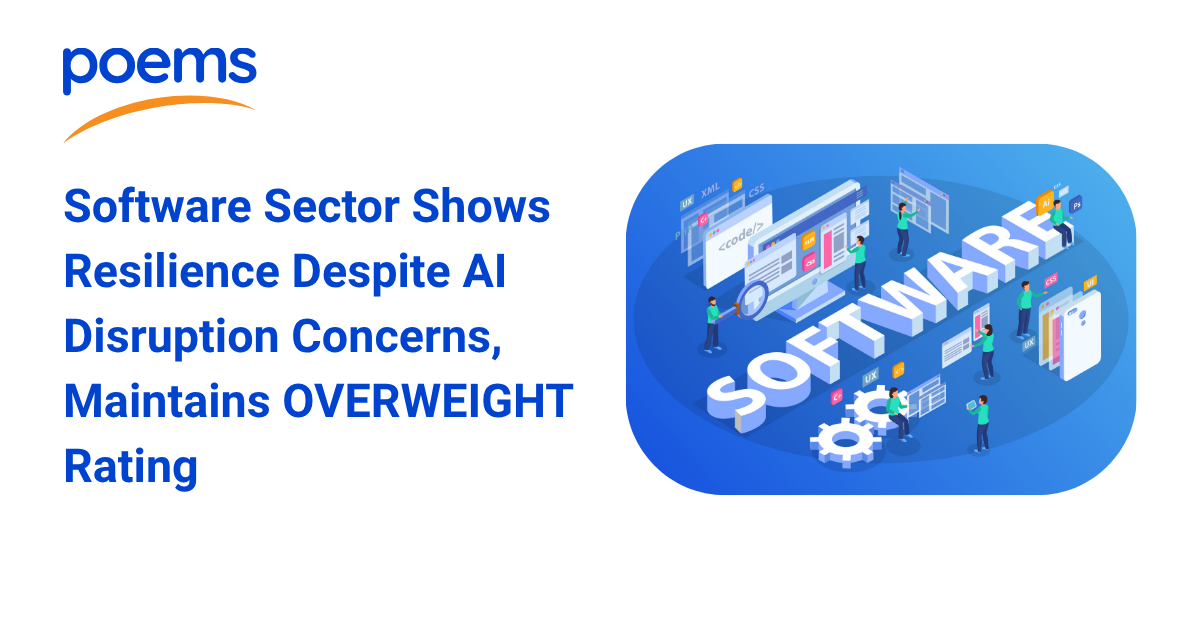
Software Sector Remains Resilient Amid AI Disruption Concerns
Market Performance and Sector Dynamics The software sector experienced notable volatility in the first quarter of 2026, with the iShares Expanded Tech-Software Sector ETF (IGV) declining 20% year-to-date despite a 4% quarter-on-quarter recovery. This performance significantly lagged the S&P 500's 8% gain, reflecting investor concerns about higher capital expenditure guidance and a rotation towards AI infrastructure plays. Within the ETF, performance diverged sharply across different software categories. Cybersecurity leaders Palo Alto Networks (PANW) and CrowdStrike (CRWD) outperformed, alongside data analytics companies MongoDB (MDB) and Snowflake (SNOW). However, traditional software-as-a-service (SaaS) companies faced significant pressure, with Palantir declining 40%, Adobe falling 44%, and Salesforce dropping 43% amid SaaS derating and concerns about agentic AI disruption. Fundamental Strength Persists Despite market pessimism surrounding potential AI disruption, the underlying fundamentals of the software sector remain robust. SaaS companies delivered their strongest revenue performance in 14 quarters, with last-12-months revenue growth accelerating to 17% year-on-year in the first quarter of 2026, representing a 4.4 percentage point improvement from the previous year. Large-cap SaaS companies demonstrated particular resilience, maintaining 17% year-on-year growth while preserving superior profitability metrics. This performance suggests that market leaders have experienced limited disruption from AI technologies, contrary to broader market concerns about sector-wide displacement. Investment Strategy and Outlook Phillip Securities Research maintains an OVERWEIGHT rating on the software sector, focusing on three key areas positioned to benefit from AI adoption: SaaS infrastructure, cybersecurity, and data analytics. Top stock picks include Microsoft, Oracle, Palantir, and Palo Alto Networks, supported by strong AI and cloud adoption trends, robust demand visibility, and growing cybersecurity requirements. The current valuation environment presents opportunities, with large-cap SaaS companies trading at EV/Sales ratios of 9.5 times, representing the negative one standard deviation level despite rising software revenue and net income. The strategy emphasizes companies that provide essential AI infrastructure, maintain mission-critical cybersecurity functions, and offer data analytics capabilities crucial for enterprise AI implementation. Frequently Asked Questions [market_journal_faq] This article has been auto-generated using PhillipGPT. It is based on a report by a Phillip Securities Research analyst. Disclaimer These commentaries are intended for general circulation and do not have regard to the specific investment objectives, financial situation and particular needs of any person. Accordingly, no warranty whatsoever is given and no liability whatsoever is accepted for any loss arising whether directly or indirectly as a result of any person acting based on this information. You should seek advice from a financial adviser regarding the suitability of any investment product(s) mentioned herein, taking into account your specific investment objectives, financial situation or particular needs, before making a commitment to invest in such products. Opinions expressed in these commentaries are subject to change without notice. Investments are subject to investment risks including the possible loss of the principal amount invested. The value of units in any fund and the income from them may fall as well as rise. Past performance figures as well as any projection or forecast used in these commentaries are not necessarily indicative of future or likely performance. Phillip Securities Pte Ltd (PSPL), its directors, connected persons or employees may from time to time have an interest in the financial instruments mentioned in these commentaries. The information contained in these commentaries has been obtained from public sources which PSPL has no reason to believe are unreliable and any analysis, forecasts, projections, expectations and opinions (collectively the “Research”) contained in these commentaries are based on such information and are expressions of belief only. PSPL has not verified this information and no representation or warranty, express or implied, is made that such information or Research is accurate, complete or verified or should be relied upon as such. Any such information or Research contained in these commentaries are subject to change, and PSPL shall not have any responsibility to maintain the information or Research made available or to supply any corrections, updates or releases in connection therewith. In no event will PSPL be liable for any special, indirect, incidental or consequential damages which may be incurred from the use of the information or Research made available, even if it has been advised of the possibility of such damages. The companies and their employees mentioned in these commentaries cannot be held liable for any errors, inaccuracies and/or omissions howsoever caused. Any opinion or advice herein is made on a general basis and is subject to change without notice. The information provided in these commentaries may contain optimistic statements regarding future events or future financial performance of countries, markets or companies. You must make your own financial assessment of the relevance, accuracy and adequacy of the information provided in these commentaries. Views and any strategies described in these commentaries may not be suitable for all investors. Opinions expressed herein may differ from the opinions expressed by other units of PSPL or its connected persons and associates. Any reference to or discussion of investment products or commodities in these commentaries is purely for illustrative purposes only and must not be construed as a recommendation, an offer or solicitation for the subscription, purchase or sale of the investment products or commodities mentioned. This advertisement has not been reviewed by the Monetary Authority of Singapore.

UltraGreen.ai Positioned for Growth with ICG Platform Expansion, BUY Rating and US$1.92 Target Price
Phillip Securities Research has initiated coverage on UltraGreen.ai with a BUY rating and target price of US$1.92, highlighting the company's transformation from a traditional dye and hardware business into an integrated indocyanine green (ICG) platform. The research firm's valuation is based on DCF analysis, utilising a 10% WACC and 7 times exit multiple. The company is currently trading at FY26e forward P/E of 15.2 times and EV/EBITDA of 16 times. Company Overview UltraGreen.ai operates in the fluorescence-guided surgery market, providing ICG dyes and near-infrared imaging hardware to healthcare providers. The company is expanding its business model beyond commodity products to become a comprehensive ICG platform provider, incorporating data analytics and software solutions. Market Opportunity and Penetration Drivers Strong market tailwinds are driving greater ICG penetration across both established and emerging surgical procedures globally. Currently, ICG penetration across surgical procedures remains in the low double-digits, with the exception of choroid diagnostics. However, penetration rates are expected to increase by double digits across the majority of procedures using fluorescence-guided surgery by 2028. The primary driver for this expansion is the growing adoption of ICG as a standard of care, with major surgical societies incorporating ICG into their clinical guidelines. A significant catalyst for UltraGreen.ai will be the expiry of Novadaq's Breast Sentinel Lymph Node exclusivity in June 2026, enabling the company to file for US approval and potentially capture a US$66.2 million market opportunity at full ICG penetration. Platform Business Transformation UltraGreen.ai is strategically expanding from its traditional dye plus hardware business into an integrated ICG platform through its PerfusionWorks quantification software and cloud platform. The PerfusionWorks software is expected to receive Europe MDR regulatory approval by 2H26, with subsequent US FDA filing planned to use the European dataset. Notably, the software is camera agnostic and can be used with competitors' imaging hardware, making every near-infrared-capable imaging device a potential customer. This approach addresses the critical obstacle of subjectivity in fluorescence imaging assessment by providing objective and reproducible perfusion data, thereby facilitating standardisation required for broader ICG adoption as a standard of care. Growth Strategy and Financial Position The company maintains a robust financial position, with net cash of US$176.1 million and is pursuing growth initiatives worth approximately US$150 million in potential investments or acquisitions across API suppliers, distributors, and lyophilisation companies. UltraGreen.ai also plans to transition from distributor models to direct sales in select markets, reducing distributor fees and enabling direct hospital relationships. This would support the bundling ICG vials with NIR cameras and cross-selling PerfusionWorks software. The research forecasts a 2-year earnings CAGR of 18.6%. Frequently Asked Questions [market_journal_faq] This article has been auto-generated using PhillipGPT. It is based on a report by a Phillip Securities Research analyst. Disclaimer These commentaries are intended for general circulation and do not have regard to the specific investment objectives, financial situation and particular needs of any person. Accordingly, no warranty whatsoever is given and no liability whatsoever is accepted for any loss arising whether directly or indirectly as a result of any person acting based on this information. You should seek advice from a financial adviser regarding the suitability of any investment product(s) mentioned herein, taking into account your specific investment objectives, financial situation or particular needs, before making a commitment to invest in such products. Opinions expressed in these commentaries are subject to change without notice. Investments are subject to investment risks including the possible loss of the principal amount invested. The value of units in any fund and the income from them may fall as well as rise. Past performance figures as well as any projection or forecast used in these commentaries are not necessarily indicative of future or likely performance. Phillip Securities Pte Ltd (PSPL), its directors, connected persons or employees may from time to time have an interest in the financial instruments mentioned in these commentaries. The information contained in these commentaries has been obtained from public sources which PSPL has no reason to believe are unreliable and any analysis, forecasts, projections, expectations and opinions (collectively the “Research”) contained in these commentaries are based on such information and are expressions of belief only. PSPL has not verified this information and no representation or warranty, express or implied, is made that such information or Research is accurate, complete or verified or should be relied upon as such. Any such information or Research contained in these commentaries are subject to change, and PSPL shall not have any responsibility to maintain the information or Research made available or to supply any corrections, updates or releases in connection therewith. In no event will PSPL be liable for any special, indirect, incidental or consequential damages which may be incurred from the use of the information or Research made available, even if it has been advised of the possibility of such damages. The companies and their employees mentioned in these commentaries cannot be held liable for any errors, inaccuracies and/or omissions howsoever caused. Any opinion or advice herein is made on a general basis and is subject to change without notice. The information provided in these commentaries may contain optimistic statements regarding future events or future financial performance of countries, markets or companies. You must make your own financial assessment of the relevance, accuracy and adequacy of the information provided in these commentaries. Views and any strategies described in these commentaries may not be suitable for all investors. Opinions expressed herein may differ from the opinions expressed by other units of PSPL or its connected persons and associates. Any reference to or discussion of investment products or commodities in these commentaries is purely for illustrative purposes only and must not be construed as a recommendation, an offer or solicitation for the subscription, purchase or sale of the investment products or commodities mentioned. This advertisement has not been reviewed by the Monetary Authority of Singapore.

Company Overview Thai Beverage PLC operates as one of Southeast Asia's leading beverage companies, with significant operations spanning alcoholic beverages, including beer and spirits, as well as non-alcoholic products. The company has established itself as a major player in the regional market through its diverse portfolio and strategic investments, including its position as the second-largest shareholder in Vinamilk, one of the Vietnam’s largest dairy companies. Strategic Response to Consumer Pressures Thai Beverage is implementing a comprehensive five-pronged strategy to address the current challenging consumer environment. The company is focusing on smaller pack sizes and stock-keeping units (SKUs) to achieve more affordable price points, recognising that consumers are searching for value during this difficult period. The strategy extends to health and wellness through protein-based non-alcoholic products, whilst offering greater convenience through ready-to-drink (RTD) spirits. The RTD spirits initiative represents a particularly strategic move, as it does not cannibalise existing distilled spirits sales but instead makes products more accessible and convenient for consumers. This category can attract consumers from the beer segment whilst delivering higher gross margins due to lower excise duties compared to beer. Importantly, existing manufacturing capacity already supports RTD spirits production, requiring minimal additional capital expenditure. Financial Outlook and Market Position The company's financial position is expected to strengthen as free cash flow improves following major capital expenditure over the past two years in Cambodia and a dairy farm in Malaysia. This improved balance sheet provides flexibility for potential acquisitions, whilst forward purchases of raw materials are largely hedged for the current financial year's requirements. Phillip Securities Research maintains a BUY recommendation with a target price of S$0.53, highlighting Thai Beverage’s attractive valuations at 10 times FY26e earnings, with a dividend yield of approximately 5.5%. Margins are expected to remain resilient due to lower-priced raw materials purchased and disciplined operating cost management. The potential spinoff of Beerco presents an asset monetisation opportunity, particularly given Southeast Asia's, especially Vietnam's, attractiveness to strategic investors as a growing consumer market. Frequently Asked Questions [market_journal_faq] This article has been auto-generated using PhillipGPT. It is based on a report by a Phillip Securities Research analyst. Disclaimer These commentaries are intended for general circulation and do not have regard to the specific investment objectives, financial situation and particular needs of any person. Accordingly, no warranty whatsoever is given and no liability whatsoever is accepted for any loss arising whether directly or indirectly as a result of any person acting based on this information. You should seek advice from a financial adviser regarding the suitability of any investment product(s) mentioned herein, taking into account your specific investment objectives, financial situation or particular needs, before making a commitment to invest in such products. Opinions expressed in these commentaries are subject to change without notice. Investments are subject to investment risks including the possible loss of the principal amount invested. The value of units in any fund and the income from them may fall as well as rise. Past performance figures as well as any projection or forecast used in these commentaries are not necessarily indicative of future or likely performance. Phillip Securities Pte Ltd (PSPL), its directors, connected persons or employees may from time to time have an interest in the financial instruments mentioned in these commentaries. The information contained in these commentaries has been obtained from public sources which PSPL has no reason to believe are unreliable and any analysis, forecasts, projections, expectations and opinions (collectively the “Research”) contained in these commentaries are based on such information and are expressions of belief only. PSPL has not verified this information and no representation or warranty, express or implied, is made that such information or Research is accurate, complete or verified or should be relied upon as such. Any such information or Research contained in these commentaries are subject to change, and PSPL shall not have any responsibility to maintain the information or Research made available or to supply any corrections, updates or releases in connection therewith. In no event will PSPL be liable for any special, indirect, incidental or consequential damages which may be incurred from the use of the information or Research made available, even if it has been advised of the possibility of such damages. The companies and their employees mentioned in these commentaries cannot be held liable for any errors, inaccuracies and/or omissions howsoever caused. Any opinion or advice herein is made on a general basis and is subject to change without notice. The information provided in these commentaries may contain optimistic statements regarding future events or future financial performance of countries, markets or companies. You must make your own financial assessment of the relevance, accuracy and adequacy of the information provided in these commentaries. Views and any strategies described in these commentaries may not be suitable for all investors. Opinions expressed herein may differ from the opinions expressed by other units of PSPL or its connected persons and associates. Any reference to or discussion of investment products or commodities in these commentaries is purely for illustrative purposes only and must not be construed as a recommendation, an offer or solicitation for the subscription, purchase or sale of the investment products or commodities mentioned. This advertisement has not been reviewed by the Monetary Authority of Singapore.

Micron Technology Benefits from AI Memory Demand and Tight Supply
Company Overview Micron Technology, Inc. is a leading semiconductor company specializing in memory solutions, producing both DRAM and NAND flash memory products for various applications including mobile, client, and automotive markets. Strong Financial Performance Driven by ASP Surge Micron delivered exceptional third-quarter FY2026 results, with adjusted profit after tax and minority interests spiking 12.2 times year-on-year to a record US$28.9 billion. This remarkable performance was underpinned by 41% year-on-year bit shipment growth and substantial average selling price (ASP) increases, estimated at 215% for DRAM and 272% for NAND products. The nine-month FY2026 revenue and adjusted PATMI reached 73% and 72% of full-year forecasts respectively, indicating strong momentum. Revenue surged to US$42 billion whilst profit margins expanded significantly, with gross margins reaching 84.9%, driven primarily by the higher ASPs across both memory segments. Strategic Customer Agreements Reduce Cyclicality A key positive development is Micron's progress in securing long-term strategic customer agreements (SCAs). The company has signed 16 such agreements to date, covering approximately 20% of DRAM volume and 30% of NAND volume from 2026 to 2030. These agreements represent US$100 billion in remaining performance obligations, equivalent to 2.7 times FY25 revenue, with US$22 billion in cash deposits and financial commitments from customers. The SCAs include price bands with floor prices that enable higher gross margins than Micron's historical peak of 63%. This structure provides greater revenue visibility and reduces the company's traditional cyclical exposure, although approximately 75% of revenue remains subject to cyclical demand patterns in mobile, client, and automotive segments. Market Dynamics Support Pricing Power Memory supply remains constrained due to lengthy lead times for new fabrication facility expansions, which typically require 2 to 4 years, alongside persistent cleanroom space limitations. Customers are prioritizing volume security over price considerations, leading major players including Samsung, SK Hynix, and Micron to sign longer-term contracts spanning 3 to 5 years, compared to typical one-year commitments historically. Investment Recommendation Phillip Securities Research maintains a BUY rating with a raised target price of US$1870, reflecting increased FY27 revenue and PATMI forecasts raised by 16% and 23% respectively. The valuation assumes a 14 times FY27 price-to-earnings ratio, representing a 52% discount to peers' average forward P/E of 29 times, acknowledging the remaining cyclical exposure in non-SCA revenue streams. Frequently Asked Questions [market_journal_faq] This article has been auto-generated using PhillipGPT. It is based on a report by a Phillip Securities Research analyst. Disclaimer These commentaries are intended for general circulation and do not have regard to the specific investment objectives, financial situation and particular needs of any person. Accordingly, no warranty whatsoever is given and no liability whatsoever is accepted for any loss arising whether directly or indirectly as a result of any person acting based on this information. You should seek advice from a financial adviser regarding the suitability of any investment product(s) mentioned herein, taking into account your specific investment objectives, financial situation or particular needs, before making a commitment to invest in such products. Opinions expressed in these commentaries are subject to change without notice. Investments are subject to investment risks including the possible loss of the principal amount invested. The value of units in any fund and the income from them may fall as well as rise. Past performance figures as well as any projection or forecast used in these commentaries are not necessarily indicative of future or likely performance. Phillip Securities Pte Ltd (PSPL), its directors, connected persons or employees may from time to time have an interest in the financial instruments mentioned in these commentaries. The information contained in these commentaries has been obtained from public sources which PSPL has no reason to believe are unreliable and any analysis, forecasts, projections, expectations and opinions (collectively the “Research”) contained in these commentaries are based on such information and are expressions of belief only. PSPL has not verified this information and no representation or warranty, express or implied, is made that such information or Research is accurate, complete or verified or should be relied upon as such. Any such information or Research contained in these commentaries are subject to change, and PSPL shall not have any responsibility to maintain the information or Research made available or to supply any corrections, updates or releases in connection therewith. In no event will PSPL be liable for any special, indirect, incidental or consequential damages which may be incurred from the use of the information or Research made available, even if it has been advised of the possibility of such damages. The companies and their employees mentioned in these commentaries cannot be held liable for any errors, inaccuracies and/or omissions howsoever caused. Any opinion or advice herein is made on a general basis and is subject to change without notice. The information provided in these commentaries may contain optimistic statements regarding future events or future financial performance of countries, markets or companies. You must make your own financial assessment of the relevance, accuracy and adequacy of the information provided in these commentaries. Views and any strategies described in these commentaries may not be suitable for all investors. Opinions expressed herein may differ from the opinions expressed by other units of PSPL or its connected persons and associates. Any reference to or discussion of investment products or commodities in these commentaries is purely for illustrative purposes only and must not be construed as a recommendation, an offer or solicitation for the subscription, purchase or sale of the investment products or commodities mentioned. This advertisement has not been reviewed by the Monetary Authority of Singapore.

Save on Brokerage Fees When Trading with CPF/SRS Funds
If you want to invest using your CPF Investment Account (CPFIS) or Supplementary Retirement Scheme (SRS) funds, you can choose between our Cash Plus Account and Cash Management Account. Both account types allow you to trade using your CPF/SRS monies. Read on to find out how they differ! Cash Plus Account Cash Plus Account offers a significantly lower brokerage rate of 0.08% with no minimum commission for trading on the SGX market. To place a BUY order, you will need to prefund your account with cash. A minimum of 50% of the expected trade value* is required as buying power before a trade can be placed or submitted online. The good news is that cash is only required temporarily. Once the CPF/SRS trade is settled, the prefunded amount can be withdrawn or used for the next trade. This could potentially result in significant cost savings for smaller trades and Dollar Cost Averaging (DCA) strategy! *Full amount is required for non-marginable counters Cash Management Account Cash Management Account offers greater convenience as no prefunding is required. We will increase your trading limit after reviewing your CPF/SRS statements. This allows you to place trades directly using the approved trading limit. However, the brokerage fee is higher at 0.28%, subject to a minimum commission of S$25. Example: BUY 100 shares of DBS at S$64.38 per share Trade Value: S$6,438 Under Cash Management Account: Approx. Brokerage Fee: S$25 (Minimum commission applies) Under Cash Plus Account: Approx. Brokerage Fee: S$5.20 By prefunding the required amount on Cash Plus Account, you could save approximately SGD 20 on brokerage fees for this trade alone. Which account should you choose? If you are comfortable prefunding your account with cash, the Cash Plus Account can help you reduce trading costs substantially. The prefunded cash can be withdrawn after the CPF/SRS transaction has been settled. If you prefer the convenience of trading without prefunding, Cash Management Account may be more suitable, although the brokerage charges will be higher. For investors looking to minimize trading costs, the Cash Plus Account is generally the more cost-effective option. Disclaimer These commentaries are intended for general circulation and do not have regard to the specific investment objectives, financial situation and particular needs of any person. Accordingly, no warranty whatsoever is given and no liability whatsoever is accepted for any loss arising whether directly or indirectly as a result of any person acting based on this information. You should seek advice from a financial adviser regarding the suitability of any investment product(s) mentioned herein, taking into account your specific investment objectives, financial situation or particular needs, before making a commitment to invest in such products. Opinions expressed in these commentaries are subject to change without notice. Investments are subject to investment risks including the possible loss of the principal amount invested. The value of units in any fund and the income from them may fall as well as rise. Past performance figures as well as any projection or forecast used in these commentaries are not necessarily indicative of future or likely performance. Phillip Securities Pte Ltd (PSPL), its directors, connected persons or employees may from time to time have an interest in the financial instruments mentioned in these commentaries. The information contained in these commentaries has been obtained from public sources which PSPL has no reason to believe are unreliable and any analysis, forecasts, projections, expectations and opinions (collectively the “Research”) contained in these commentaries are based on such information and are expressions of belief only. PSPL has not verified this information and no representation or warranty, express or implied, is made that such information or Research is accurate, complete or verified or should be relied upon as such. Any such information or Research contained in these commentaries are subject to change, and PSPL shall not have any responsibility to maintain the information or Research made available or to supply any corrections, updates or releases in connection therewith. In no event will PSPL be liable for any special, indirect, incidental or consequential damages which may be incurred from the use of the information or Research made available, even if it has been advised of the possibility of such damages. The companies and their employees mentioned in these commentaries cannot be held liable for any errors, inaccuracies and/or omissions howsoever caused. Any opinion or advice herein is made on a general basis and is subject to change without notice. The information provided in these commentaries may contain optimistic statements regarding future events or future financial performance of countries, markets or companies. You must make your own financial assessment of the relevance, accuracy and adequacy of the information provided in these commentaries. Views and any strategies described in these commentaries may not be suitable for all investors. Opinions expressed herein may differ from the opinions expressed by other units of PSPL or its connected persons and associates. Any reference to or discussion of investment products or commodities in these commentaries is purely for illustrative purposes only and must not be construed as a recommendation, an offer or solicitation for the subscription, purchase or sale of the investment products or commodities mentioned. This advertisement has not been reviewed by the Monetary Authority of Singapore.