Convexity
Table of Contents
Convexity
Applying the duration and convexity ideas is crucial when assessing bonds. A bond’s or bond portfolio’s approximate price change can be predicted quite well using duration. However, duration loses accuracy in projecting price movements for assets with embedded options and bigger yield changes. Duration and convexity can be coupled to approximate the price for a given change in yield more closely.
The convexity of a bond portfolio can significantly impact the portfolio’s overall return. For example, a portfolio with positive convexity will typically outperform a portfolio with negative convexity when interest rates rise. This is because the YTM curve of a portfolio with positive convexity will become steeper as interest rates rise, which means that the portfolio’s overall return will increase faster than a portfolio with negative convexity.
Overall, the convexity of a bond portfolio is an important consideration for investors when choosing which bonds to include in their portfolio.
What is convexity?
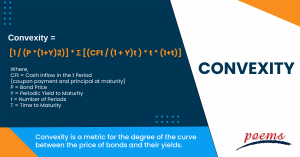
Convexity is a metric for the degree of the curve between the price of bonds and their yields. Thus, convexity is a metric for the arc of the bond price–interest rate connection. It displays how quickly a bond’s duration alters in response to changes in interest rates.
Convexity shows how the term of a bond changes when the interest rate changes. If a bond’s duration increases along with yields, this is called negative convexity. If a bond’s tenure lengthens while its yield drops, it is said to have positive convexity.
Understanding convexity
Convexity and duration are two calculated metrics that, unfortunately for bond investors, are difficult to get. Although you could theoretically calculate it on your own in Excel, and professional fund managers use sources like Bloomberg to seek this information, your best bet is to find a broker. This is because it isn’t worth the effort to learn the formula, alter it, and use it in Excel regularly. If your broker doesn’t have a bond calculator, his fixed-income offerings may be inadequate.
On a portfolio level, convexity is also incredibly helpful. When managing a bond portfolio, you can utilize duration and convexity to choose where to allocate existing bond positions and new purchases based on the portfolio’s duration and convexity.
Apply the same interest-rate forecast criterion when considering the overall impact of a new position and its allocation. Using position sizes and diversity to reduce risk, you can still buy bonds you like, even if their duration or convexity is at odds with your predicted interest rate.
Convexity and duration
Investors can learn how interest rate changes will impact a bond’s price using duration and convexity measures. The course of a bond can help investors comprehend the implications for a bond’s price should interest rates change by indicating how a bond’s price responds to changes in interest rates. A bond’s convexity can be used to calculate the difference in duration for a specific change in yields.
If rates are anticipated to rise, consider investing in bonds with shorter periods. These bonds will see less market volatility and less sensitivity to yield increases than bonds with longer periods. Higher-term bonds should be taken into consideration if rates are predicted to fall. Higher-duration bonds stand to gain more than their lower-duration counterparts when rates fall, and bond prices rise.
Positive and negative convexity
If a bond’s duration increases while the yield decreases, this is referred to as positive convexity. An increase in price brought on by a decrease in rates will have a greater impact on a bond with positive convexity than a rise in price brought on by an increase in yields.
Negative convexity happens when the tenure of a bond increases at the same time that the yield does. Bond prices will fall as the yield increases. When interest rates fall, bond prices rise, but a bond with negative convexity depreciates as rates fall.
Example of convexity
Consider XYZ Corporation, a bond issuer, as having two bonds on the market now: bond A and B. Each bond has a 100,000 USD face value and a 5% coupon rate. Bond B matures in 10 years as opposed to bond A’s 5-year maturity. Bond A has a period of 4 years, but bond B has a duration of 5.5 years using the concept of duration. This implies that the price of bond A will vary by 4% for every 1% change in interest rates, whereas the price of bond B will change by 5.5%.
Let’s now assume that interest rates unexpectedly rise by 2%. Accordingly, the cost of bond A should go down by 8%, while the cost of bond B would go down by 11%. However, based solely on bond B’s term, the price movement will be less than anticipated using the idea of convexity.
This is because bond B has a higher convexity. After all, it has a longer maturity. Bond B’s higher convexity protects against changes in interest rates, resulting in a less significant price movement than predicted based on tenure.
Frequently Asked Questions
Convexity = [1 / (P *(1+Y)2)] * Σ [(CFt / (1 + Y)t ) * t * (1+t)]
Where,
CFt = Cash inflow in the t Period (coupon payment and principal at maturity)
P = Bond Price
Y = Periodic Yield to Maturity
t = Number of Periods
T = Time to Maturity
The convexity of a bond gauges how sensitive its duration is to variations in yield. A bond’s price change can’t be accurately measured by duration since it suggests that the change is linear when it has a sloped or “convex” shape.
The bond convexity formula is computed by dividing the total of the bond’s discounted future cash inflow by the number of years it will be outstanding by the sum of the bond’s discounted future cash inflow.
We include the convexity adjustment to our initial duration calculation to estimate the change in the bond’s price given a specific change in yield. The convexity (C) formula is C=1P∂2P∂y2. where y is the yield-to-maturity and P is the bond’s price.
When we talk about the convexity of a bond portfolio, we refer to the degree of curvature in the portfolio’s yield-to-maturity (YTM) curve. A bond portfolio with positive convexity will have a positively curved YTM curve, while a bond portfolio with negative convexity will have a negatively curved YTM curve.
The convexity of a bond portfolio is computed by dividing the total of the discounted future cash inflow of the bond and the corresponding number of years by the sum of the discounted future cash inflow.
Related Terms
- Notional amount
- Negative convexity
- Jumbo pools
- Inverse floater
- Forward Swap
- Underwriting risk
- Reinvestment risk
- Final Maturity Date
- Bullet Bonds
- Constant prepayment rate
- Covenants
- Companion tranche
- Savings bond calculator
- Variable-Interest Bonds
- Warrant Bonds
- Notional amount
- Negative convexity
- Jumbo pools
- Inverse floater
- Forward Swap
- Underwriting risk
- Reinvestment risk
- Final Maturity Date
- Bullet Bonds
- Constant prepayment rate
- Covenants
- Companion tranche
- Savings bond calculator
- Variable-Interest Bonds
- Warrant Bonds
- Eurobonds
- Emerging Market Bonds
- Serial bonds
- Equivalent Taxable Yield
- Equivalent Bond Yield
- Performance bond
- Death-Backed Bonds
- Joint bond
- Obligation bond
- Bond year
- Overhanging bonds
- Bond swap
- Concession bonds
- Adjustable-rate mortgage
- Bondholder
- Yen bond
- Liberty bonds
- Premium bond
- Gold bond
- Reset bonds
- Refunded bond
- Additional bonds test
- Corporate bonds
- Coupon payments
- Authority bond
- Clean price
- Secured bonds
- Revenue bonds
- Perpetual bonds
- Municipal bonds
- Quote-Driven Market
- Debenture
- Fixed-rate bond
- Zero-coupon bond
- Compounding
- Parallel bonds
- Junk bonds
- Green bonds
- Average maturity
- Investment grade bonds
- Convertible Bonds
Most Popular Terms
Other Terms
- Adjusted distributed income
- International securities exchanges
- Settlement currency
- Federal funds rate
- Active Tranche
- Convertible Securities
- Synthetic ETF
- Physical ETF
- Initial Public Offering
- Buyback
- Secondary Sharing
- Bookrunner
- Payment Date
- Secondary Market
- Margin Requirement
- Mark-to-market
- Pledged Asset
- Yield Pickup
- Subordinated Debt
- Trailing Stops
- Treasury Stock Method
- Stochastic Oscillator
- Basket Trade
- Contrarian Strategy
- Exchange Control
- Notional Value
- Relevant Cost
- Dow Theory
- Speculation
- Stub
- Trading Volume
- Going Long
- Pink sheet stocks
- Rand cost averaging
- Sustainable investment
- Stop-limit sell order
- Economic Bubble
- Ask Price
- Stock symbol
- Synthetic replication
- Bourse
- Beneficiary
- Witching Hour
- Widow and Orphan stock
- Public Float
- Closing Price
- Reverse stock splits
- Quiet period
- Prepayment risk
- Interpolation
Know More about
Tools/Educational Resources
Markets Offered by POEMS
Read the Latest Market Journal

Navigating the vast world of unit trusts can be daunting. With nearly 2000 funds available...
Predicting Trend Reversals with Candlestick Patterns for Beginners
Candlestick patterns are used to predict the future direction of price movements as they contain...

In the diverse and complex world of investing, unit trusts stand out as a popular...

Back in Business: The Return of IPOs & Top Traded Counters in March 2024
Start trading on POEMS! Open a free account here! At a glance: Major indices continue...
Weekly Updates 15/4/24 – 19/4/24
This weekly update is designed to help you stay informed and relate economic and company...
From $50 to $100: Unveiling the Impact of Inflation
In recent years, inflation has become a hot topic, evoking strong emotions as the cost...

Japan’s Economic Resurgence: Unveiling the Tailwinds Behind Nikkei 225’s Record Leap
Source: eSignal, Intercontinental Exchange, Inc. In the heart of Japan’s economic landscape, the Nikkei 225...
Weekly Updates 8/4/24 – 12/4/24
This weekly update is designed to help you stay informed and relate economic and...


