
Diluted Earnings Per Share
Diluted Earnings Per Share is the distribution of net profit earned by a company to each share of the total outstanding amount. It can impact the amount each share will receive. People often use the terms EPS and Diluted EPS interchangeably, yet they are significantly different. EPS considers only ordinary shares, whereas diluted EPS takes common shares along with employee stock options, convertible securities, and secondary offerings into account.
Table of Contents
- What are Diluted Earnings per Share (Diluted EPS)?
- Interpreting Diluted EPS – Higher or Lower?
- Basic Earnings per Share vs Diluted Earnings
- Calculating Basic Earnings per Share
- Calculating Diluted Earnings Per Share
- Diluted EPS Formula
- Diluted EPS Example Calculation
- What are Fully Diluted Shares?
- Stock-Based Compensation
- Authorised vs outstanding vs fully diluted shares
- Frequently Asked Questions
What are Diluted Earnings per Share (Diluted EPS)?
Unlike basic EPS, diluted earnings per share give detailed information about the firm’s price-to-earnings ratio. However, the current outstanding shares are not considered dilutive securities. But, they can become outstanding shares in the future.
Interpreting Diluted EPS – Higher or Lower?
The EPS figure faces downward pressure when the net dilutive impact from dilutive securities is significant. The more the EPS, the more are the chances of profitability in the long run.
Basic Earnings per Share vs Diluted Earnings
Basic earnings per share is the company’s net income divided by the outstanding number of shares. On the other hand, diluted earnings per share include all the potential dilution in the case of conversions. The conversions can be security conversions or conversions of different options into the stock. Even though both these types of EPSs are used to determine the net profit of a company, there is one significant difference between the two. Diluted EPSs takes into account common shares and convertible securities like warrants, options, and convertible debt.
Calculating Basic Earnings per Share
To calculate the basic earnings per share of a company, you need to subtract preferred dividends from the net income of the company. Then, the resultant figure is divided by the weighted average of outstanding share numbers.
Calculating Diluted Earnings Per Share
Similar to the basic earnings per share, you need to subtract the preferred stock dividends from the net income. Then, you need to divide the result by the sum of an average number of outstanding shares along with other dilutive shares that include options, warrants, and convertible debt.
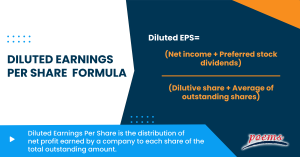
Diluted EPS Formula
Diluted EPS = (Net income + Preferred stock dividends) ÷ (Dilutive shares + Average of outstanding shares)
Diluted EPS Example Calculation
Now that you know the formula for Diluted EPS, let us look at an example. Let us assume that company XYZ had a net income of $50 million in the past year.
However, the company hasn’t paid any dividends to the shareholders and now has 15 million outstanding shares. Further, the company has stock options of 1 million that they can convert into common shares of approximately 3 million.
Based on this information, the resulting diluted earnings per share will be:
Diluted EPS = ($50,000,000 – $0) ÷ (15,000,000 + 1,000,000 + 3,000,000) = $2.63 per share.
What are Fully Diluted Shares?
Fully Diluted Shares are the total number of outstanding shares that are available to trade in the open market. This is achieved when all the dilutive securities like employee stock options and convertible bonds are exercised.
Diluted Shares – Impact on EPS
Diluted EPS is always lower as compared to basic EPS. The reason for this is that when all the dilutive securities are converted, it leads to a decrease in EPS. Hence, we can say that diluted shares negatively affect/impact the earnings per share of a company.
Stock-Based Compensation
Stock-based compensation, also known as share-based compensation, is a simple way that a company uses to pay compensation to directors, employees, and executives. Some of the most common types of stock-based compensation include stock options, shares and restricted share units.
Authorised vs outstanding vs fully diluted shares
There are three main types of claims that companies often prioritise. To help you get a better idea, here is a brief description of the three types of claims.
- Authorised shares: These are the maximum legal claims that a particular company can issue to shareholders.
- Outstanding shares: These are the current shares that shareholders hold.
- Fully diluted shares: The addition of issued, outstanding shares and the shares that a company will get through conversions.
Frequently Asked Questions
A fully-diluted basis refers to a particular company’s shares given to the shareholders. Here, all the other claims that come from the conversions of securities are also calculated.
A fully-diluted valuation means that all the obligations and plans (both potential and outstanding) are calculated before issuing the shares.
A high, fully diluted market cap ensures that there will be more circulation of tokens in the future. It is a good metric, especially for a long-term investor who wishes to judge how profitable a particular project is for investment.
Yes, diluted EPS is much better than basic EPS as it takes all the potential dilutions into account during calculation. In short, the diluted EPS can offer a comprehensive view of potential earnings and profit per share.
Yes, during the calculation of the P/E ratio, diluted EPS is taken into consideration. The general definition of the P/E ratio is the price of the stock divided by the diluted EPS (earnings per share).
Related Terms
- Merger Arbitrage
- Intrinsic Value of Stock
- Callable Preferred Stock
- Growth Stocks
- Market maker
- Authorized Stock
- Dividend Discount Model
- Stock Shifts
- Seasoned Equity Offering
- Price to Book
- Stock Price
- Consumer Stock
- Undervalued Stocks
- Tracking Stock
- Income stocks
- Merger Arbitrage
- Intrinsic Value of Stock
- Callable Preferred Stock
- Growth Stocks
- Market maker
- Authorized Stock
- Dividend Discount Model
- Stock Shifts
- Seasoned Equity Offering
- Price to Book
- Stock Price
- Consumer Stock
- Undervalued Stocks
- Tracking Stock
- Income stocks
- Hang Seng Index
- Rally
- Ticker Symbol
- Defensive stock
- Earnings Guidance
- Wire house broker
- Stock Connect
- Options expiry
- Payment Date
- Treasury Stock Method
- Reverse stock splits
- Ticker
- Restricted strict unit
- Gordon growth model
- Stock quotes
- Shadow Stock
- Margin stock
- Dedicated Capital
- Whisper stock
- Voting Stock
- Deal Stock
- Microcap stock
- Capital Surplus
- Multi-bagger Stocks
- Shopped stock
- Secondary stocks
- Screen stocks
- Quarter stock
- Orphan stock
- One-decision stock
- Repurchase of stock
- Stock market crash
- Half stock
- Stock options
- Stock split
- Foreign exchange markets
- Stock Market
- FAANG stocks
- Unborrowable stock
- Joint-stock company
- Over-the-counter stocks
- Watered stock
- Zero-dividend preferred stock
- Bid price
- Authorised shares
- Auction markets
- Market capitalisation
- Arbitrage
- Market capitalisation rate
- Garbatrage
- Autoregressive
- Stockholder
- Penny stock
- Noncyclical Stocks
- Hybrid Stocks
- Large Cap Stocks
- Mid Cap Stocks
- Common Stock
- Preferred Stock
- Small Cap Stocks
- Earnings Per Share (EPS)
- Dividend Yield
- Cyclical Stock
- Blue Chip Stocks
- Averaging Down
Most Popular Terms
Other Terms
- Bond Convexity
- Compound Yield
- Brokerage Account
- Discretionary Accounts
- Industry Groups
- Growth Rate
- Green Bond Principles
- Gamma Scalping
- Funding Ratio
- Free-Float Methodology
- Foreign Direct Investment (FDI)
- Floating Dividend Rate
- Flight to Quality
- Real Return
- Protective Put
- Perpetual Bond
- Option Adjusted Spread (OAS)
- Non-Diversifiable Risk
- Liability-Driven Investment (LDI)
- Income Bonds
- Guaranteed Investment Contract (GIC)
- Flash Crash
- Equity Carve-Outs
- Cost of Equity
- Cost Basis
- Deferred Annuity
- Cash-on-Cash Return
- Earning Surprise
- Capital Adequacy Ratio (CAR)
- Bubble
- Beta Risk
- Bear Spread
- Asset Play
- Accrued Market Discount
- Ladder Strategy
- Junk Status
- Interest-Only Bonds (IO)
- Interest Coverage Ratio
- Inflation Hedge
- Industry Groups
- Incremental Yield
- Industrial Bonds
- Income Statement
- Holding Period Return
- Historical Volatility (HV)
- Hedge Effectiveness
- Flat Yield Curve
- Fallen Angel
- Exotic Options
- Execution Risk
Know More about
Tools/Educational Resources
Markets Offered by POEMS
Read the Latest Market Journal

Singapore Catalist Board IPOs Outperform Mainboard; US Mega-Cap Strategy Favours Short-Term Trading
Singapore IPO Performance Reveals a Market Divide Recent analysis of Singapore's initial public offering (IPO) landscape reveals a stark performance disparity between the Mainboard and Catalist Board listings, with significant implications for investors seeking exposure to newly listed companies. Singapore Mainboard IPOs have delivered disappointing results, generating an average first-day return of -2%. This lacklustre performance is further highlighted by the fact that only one-third of IPOs managed to close above their IPO price on their debut trading day. Catalist Board Emerges as the Superior Option In contrast, Singapore's Catalist Board listings present a markedly different proposition for investors. These smaller-cap offerings have delivered reliable double-digit gains on their opening day, averaging an impressive 19.8%. The sustained post-listing gains further enhance the risk-reward profile for short-term IPO speculation. The Catalist Board's average performance across various timeframes demonstrates consistent strength, with 50.5% returns after one week, 54.3% after one month, 88.3% after three months, and 114.4% after six months. US IPO Strategy Recommendations For major US IPOs, the optimal approach differs significantly from the strategies used in Singapore. Large US offerings typically generate strong opening day momentum, averaging gains of 16%. However, the recommended strategy involves riding the initial one-week to one-month momentum wave before exiting positions ahead of lock-up expirations. Importantly, historical data suggests that buying and holding mega-cap IPOs through their first year has proven to be a value-destructive proposition, making timing crucial for US IPO investments. The analysis indicates that traders seeking short-term IPO speculation should favour Singapore's Catalist Board offerings over Mainboard listings, whilst US IPO strategies should focus on capturing initial momentum rather than long-term holding. Frequently Asked Questions [market_journal_faq] This article has been auto-generated using PhillipGPT. It is based on a report by a Phillip Securities Research analyst. Disclaimer These commentaries are intended for general circulation and do not have regard to the specific investment objectives, financial situation and particular needs of any person. Accordingly, no warranty whatsoever is given and no liability whatsoever is accepted for any loss arising whether directly or indirectly as a result of any person acting based on this information. You should seek advice from a financial adviser regarding the suitability of any investment product(s) mentioned herein, taking into account your specific investment objectives, financial situation or particular needs, before making a commitment to invest in such products. Opinions expressed in these commentaries are subject to change without notice. Investments are subject to investment risks including the possible loss of the principal amount invested. The value of units in any fund and the income from them may fall as well as rise. Past performance figures as well as any projection or forecast used in these commentaries are not necessarily indicative of future or likely performance. Phillip Securities Pte Ltd (PSPL), its directors, connected persons or employees may from time to time have an interest in the financial instruments mentioned in these commentaries. The information contained in these commentaries has been obtained from public sources which PSPL has no reason to believe are unreliable and any analysis, forecasts, projections, expectations and opinions (collectively the “Research”) contained in these commentaries are based on such information and are expressions of belief only. PSPL has not verified this information and no representation or warranty, express or implied, is made that such information or Research is accurate, complete or verified or should be relied upon as such. Any such information or Research contained in these commentaries are subject to change, and PSPL shall not have any responsibility to maintain the information or Research made available or to supply any corrections, updates or releases in connection therewith. In no event will PSPL be liable for any special, indirect, incidental or consequential damages which may be incurred from the use of the information or Research made available, even if it has been advised of the possibility of such damages. The companies and their employees mentioned in these commentaries cannot be held liable for any errors, inaccuracies and/or omissions howsoever caused. Any opinion or advice herein is made on a general basis and is subject to change without notice. The information provided in these commentaries may contain optimistic statements regarding future events or future financial performance of countries, markets or companies. You must make your own financial assessment of the relevance, accuracy and adequacy of the information provided in these commentaries. Views and any strategies described in these commentaries may not be suitable for all investors. Opinions expressed herein may differ from the opinions expressed by other units of PSPL or its connected persons and associates. Any reference to or discussion of investment products or commodities in these commentaries is purely for illustrative purposes only and must not be construed as a recommendation, an offer or solicitation for the subscription, purchase or sale of the investment products or commodities mentioned. This advertisement has not been reviewed by the Monetary Authority of Singapore.

Singapore Banking Sector Upgraded to ACCUMULATE on Rising Loan Growth and Rate Stabilisation
Company Overview This analysis covers Singapore's major banking sector, focusing on the three primary banks: DBS, OCBC, and UOB. These institutions represent the core of Singapore's financial services landscape, serving both domestic and regional markets whilst benefiting from the city-state's position as a financial hub. Upgrade to ACCUMULATE Rating Phillip Securities Research has upgraded the Singapore banking sector to ACCUMULATE from Neutral, driven by accelerating loan growth, stabilising interest rates, and improved market conditions. The research house has raised target prices across all three major banks: DBS to S$76.00 from S$67.50, OCBC to S$28.50 from S$24.00, and UOB to S$43.00 from S$39.00, reflecting higher loan growth and earnings estimates. Interest Rate Environment Stabilising Singapore's 3-month SORA rose for the second consecutive month, increasing 1 basis point month-on-month to 1.07% in June. This represents the smallest year-on-year decline in 15 months at 109 basis points, suggesting that rates are beginning to bottom out. The stabilisation reflects the Federal Reserve's increasingly hawkish stance, with June projections signalling a possible rate hike and no cuts anticipated, creating a supportive backdrop for net interest margins. Strong Loan Growth and Deposit Trends Singapore loan growth continued its surge at 8.7% year-on-year, potentially leading to upward revisions to previous guidance to low- to mid-single digit growth. Current account and savings account (CASA) deposits rose 15% year-on-year, with the CASA deposits ratio improving to 20.7% from 20.5% in April, reaching the highest level since November 2022. This trend provides a tailwind for banks by lowering funding costs and cushioning net interest margin compression. Market Volatility Benefits Ongoing geopolitical tensions, including the collapsed US-Iran ceasefire and renewed strikes lifting oil prices, continue to generate market volatility. This environment benefits capital markets income and wealth management fees, providing meaningful offsets to net interest income headwinds. The sector offers attractive dividend yields of 4.1%, with ongoing share buybacks improving return on equity. DBS is preferred for its fixed dividend policy and guidance upgrade, whilst OCBC is favoured for wealth management growth and excess capital. Frequently Asked Questions [market_journal_faq] This article has been auto-generated using PhillipGPT. It is based on a report by a Phillip Securities Research analyst. Disclaimer These commentaries are intended for general circulation and do not have regard to the specific investment objectives, financial situation and particular needs of any person. Accordingly, no warranty whatsoever is given and no liability whatsoever is accepted for any loss arising whether directly or indirectly as a result of any person acting based on this information. You should seek advice from a financial adviser regarding the suitability of any investment product(s) mentioned herein, taking into account your specific investment objectives, financial situation or particular needs, before making a commitment to invest in such products. Opinions expressed in these commentaries are subject to change without notice. Investments are subject to investment risks including the possible loss of the principal amount invested. The value of units in any fund and the income from them may fall as well as rise. Past performance figures as well as any projection or forecast used in these commentaries are not necessarily indicative of future or likely performance. Phillip Securities Pte Ltd (PSPL), its directors, connected persons or employees may from time to time have an interest in the financial instruments mentioned in these commentaries. The information contained in these commentaries has been obtained from public sources which PSPL has no reason to believe are unreliable and any analysis, forecasts, projections, expectations and opinions (collectively the “Research”) contained in these commentaries are based on such information and are expressions of belief only. PSPL has not verified this information and no representation or warranty, express or implied, is made that such information or Research is accurate, complete or verified or should be relied upon as such. Any such information or Research contained in these commentaries are subject to change, and PSPL shall not have any responsibility to maintain the information or Research made available or to supply any corrections, updates or releases in connection therewith. In no event will PSPL be liable for any special, indirect, incidental or consequential damages which may be incurred from the use of the information or Research made available, even if it has been advised of the possibility of such damages. The companies and their employees mentioned in these commentaries cannot be held liable for any errors, inaccuracies and/or omissions howsoever caused. Any opinion or advice herein is made on a general basis and is subject to change without notice. The information provided in these commentaries may contain optimistic statements regarding future events or future financial performance of countries, markets or companies. You must make your own financial assessment of the relevance, accuracy and adequacy of the information provided in these commentaries. Views and any strategies described in these commentaries may not be suitable for all investors. Opinions expressed herein may differ from the opinions expressed by other units of PSPL or its connected persons and associates. Any reference to or discussion of investment products or commodities in these commentaries is purely for illustrative purposes only and must not be construed as a recommendation, an offer or solicitation for the subscription, purchase or sale of the investment products or commodities mentioned. This advertisement has not been reviewed by the Monetary Authority of Singapore.

Strategic Acquisitions Drive Growth Q & M Dental Group Ltd has announced significant expansion plans through two major acquisitions that will substantially increase its regional footprint. The Singapore-based dental services provider is acquiring a 100% stake in Australia's Experteeth Dental Group and a 51% stake in Thailand's Deezy Dental Home for approximately S$107 million and S$39 million respectively. Company Profile Q & M Dental Group operates as a comprehensive dental services provider across the Asia-Pacific region. The company has established itself as a regional healthcare player in the healthcare sector, focusing on dental care services and clinic operations across multiple markets. Acquisition Details and Financing Structure The combined S$146 million purchase will be financed through S$92 million in cash and the issuance of 86.7 million new shares, representing 9.1% of existing shares. The new shares are priced at S$0.70 each and will be subject to a 15-year moratorium, ensuring long-term commitment from the vendors. The Australian acquisition targets Experteeth Dental Group, founded in 2017, which operates 40 dental clinics with 117 dentists across New South Wales, Victoria, Queensland, Tasmania, and the Australian Capital Territory. The group operates under multiple established brands including Elevate Dental Group, Lumiere Dental Group, Ace Dental Group, Yiruda Dental Group, Prestige Dental Group, and Bubble Teeth Dental Group. The Thai acquisition involves Deezy Dental Home, also founded in 2017, which operates three dental clinics with 41 dentists. Strong Financial Backing and Growth Prospects The acquisitions are valued at an attractive price-to-earnings ratio of 11.4 times, with the Australian operation at 10 times and the Thai operation at 16 times. Importantly, the total S$146 million investment is supported by robust profit guarantees totalling S$126 million over six to eight years. This arrangement implies earnings growth of approximately 13%, with Thailand showing the highest growth potential at 22% compound annual growth rate. Analyst Outlook Phillip Securities Research maintains a positive outlook on these acquisitions, projecting that they could increase FY26 earnings per share by 1.04 cents, representing a 54% increase to 2.96 cents, excluding intangible amortisation. The research house maintains its BUY recommendation with an unchanged target price of S$0.71, based on price-to-earnings ratio of 25 times for FY26, aligned with Singapore's healthcare sector valuation. Frequently Asked Questions [market_journal_faq] This article has been auto-generated using PhillipGPT. It is based on a report by a Phillip Securities Research analyst. Disclaimer These commentaries are intended for general circulation and do not have regard to the specific investment objectives, financial situation and particular needs of any person. Accordingly, no warranty whatsoever is given and no liability whatsoever is accepted for any loss arising whether directly or indirectly as a result of any person acting based on this information. You should seek advice from a financial adviser regarding the suitability of any investment product(s) mentioned herein, taking into account your specific investment objectives, financial situation or particular needs, before making a commitment to invest in such products. Opinions expressed in these commentaries are subject to change without notice. Investments are subject to investment risks including the possible loss of the principal amount invested. The value of units in any fund and the income from them may fall as well as rise. Past performance figures as well as any projection or forecast used in these commentaries are not necessarily indicative of future or likely performance. Phillip Securities Pte Ltd (PSPL), its directors, connected persons or employees may from time to time have an interest in the financial instruments mentioned in these commentaries. The information contained in these commentaries has been obtained from public sources which PSPL has no reason to believe are unreliable and any analysis, forecasts, projections, expectations and opinions (collectively the “Research”) contained in these commentaries are based on such information and are expressions of belief only. PSPL has not verified this information and no representation or warranty, express or implied, is made that such information or Research is accurate, complete or verified or should be relied upon as such. Any such information or Research contained in these commentaries are subject to change, and PSPL shall not have any responsibility to maintain the information or Research made available or to supply any corrections, updates or releases in connection therewith. In no event will PSPL be liable for any special, indirect, incidental or consequential damages which may be incurred from the use of the information or Research made available, even if it has been advised of the possibility of such damages. The companies and their employees mentioned in these commentaries cannot be held liable for any errors, inaccuracies and/or omissions howsoever caused. Any opinion or advice herein is made on a general basis and is subject to change without notice. The information provided in these commentaries may contain optimistic statements regarding future events or future financial performance of countries, markets or companies. You must make your own financial assessment of the relevance, accuracy and adequacy of the information provided in these commentaries. Views and any strategies described in these commentaries may not be suitable for all investors. Opinions expressed herein may differ from the opinions expressed by other units of PSPL or its connected persons and associates. Any reference to or discussion of investment products or commodities in these commentaries is purely for illustrative purposes only and must not be construed as a recommendation, an offer or solicitation for the subscription, purchase or sale of the investment products or commodities mentioned. This advertisement has not been reviewed by the Monetary Authority of Singapore.

Semiconductor Sector Sustains Strong Growth Momentum with Accelerating Revenue Expansion
Sector Performance Driven by Memory Boom and AI Infrastructure Demand The semiconductor sector continues to demonstrate robust growth momentum, with the Semiconductor ETF surging 39.9% over the past three months, significantly outperforming the S&P 500's 11.4% gain. Memory companies have emerged as the standout performers, posting exceptional gains of 95% driven by extraordinary first-quarter 2026 earnings growth exceeding 900% year-on-year. This remarkable performance stems from a substantial surge in DRAM and NAND prices amid widespread memory chip shortages. Extended Supply Contracts Signal Long-Term Industry Stability A notable shift in industry dynamics has emerged through the establishment of longer-term supply agreements. Hyperscalers and high-end chipmakers are now committing to multi-year contracts extending until 2030, representing a significant departure from previous agreements that typically lasted only one year with flexible financing terms. These new arrangements require approximately 20% cash deposits to secure supply, demonstrating the critical importance of memory chips in AI data centre buildouts. Equipment manufacturers report that these extended memory contracts provide enhanced supply chain visibility extending through the end of 2027. Processor Segment Shows Accelerating Growth Trajectory The processor segment continues its growth acceleration, with first-quarter 2026 revenue surging 53% year-on-year, up from 40% growth in the fourth quarter of 2025. This momentum is expected to continue, with second-quarter 2026 revenue guidance indicating a substantial 67% year-on-year increase to US$159 billion. The growth is underpinned by robust hyperscaler demand for data centre GPUs, CPUs, and ASICs. NVIDIA leads the sector with first-quarter revenue spiking 85% year-on-year to US$81.6 billion, marking the third consecutive quarter of accelerating growth. AMD demonstrated its strongest year-on-year growth since 2022, with revenue increasing 38% to US$10.3 billion, driven by MI350 GPU and fifth-generation EPYC CPU adoption. Broadcom achieved its strongest growth since 2016, with revenue rising 48% year-on-year to US$22.2 billion, supported by AI semiconductor revenue that grew 143% year-on-year to a record US$10.8 billion. The sector maintains strong forward momentum, supported by hyperscalers' combined 2026 capital expenditure guidance of US$710 billion, representing an 89% year-on-year increase. Equipment players continue to benefit from strong services demand as memory customers seek performance upgrades on existing tools due to limited cleanroom space. Frequently Asked Questions [market_journal_faq] This article has been auto-generated using PhillipGPT. It is based on a report by a Phillip Securities Research analyst. Disclaimer These commentaries are intended for general circulation and do not have regard to the specific investment objectives, financial situation and particular needs of any person. Accordingly, no warranty whatsoever is given and no liability whatsoever is accepted for any loss arising whether directly or indirectly as a result of any person acting based on this information. You should seek advice from a financial adviser regarding the suitability of any investment product(s) mentioned herein, taking into account your specific investment objectives, financial situation or particular needs, before making a commitment to invest in such products. Opinions expressed in these commentaries are subject to change without notice. Investments are subject to investment risks including the possible loss of the principal amount invested. The value of units in any fund and the income from them may fall as well as rise. Past performance figures as well as any projection or forecast used in these commentaries are not necessarily indicative of future or likely performance. Phillip Securities Pte Ltd (PSPL), its directors, connected persons or employees may from time to time have an interest in the financial instruments mentioned in these commentaries. The information contained in these commentaries has been obtained from public sources which PSPL has no reason to believe are unreliable and any analysis, forecasts, projections, expectations and opinions (collectively the “Research”) contained in these commentaries are based on such information and are expressions of belief only. PSPL has not verified this information and no representation or warranty, express or implied, is made that such information or Research is accurate, complete or verified or should be relied upon as such. Any such information or Research contained in these commentaries are subject to change, and PSPL shall not have any responsibility to maintain the information or Research made available or to supply any corrections, updates or releases in connection therewith. In no event will PSPL be liable for any special, indirect, incidental or consequential damages which may be incurred from the use of the information or Research made available, even if it has been advised of the possibility of such damages. The companies and their employees mentioned in these commentaries cannot be held liable for any errors, inaccuracies and/or omissions howsoever caused. Any opinion or advice herein is made on a general basis and is subject to change without notice. The information provided in these commentaries may contain optimistic statements regarding future events or future financial performance of countries, markets or companies. You must make your own financial assessment of the relevance, accuracy and adequacy of the information provided in these commentaries. Views and any strategies described in these commentaries may not be suitable for all investors. Opinions expressed herein may differ from the opinions expressed by other units of PSPL or its connected persons and associates. Any reference to or discussion of investment products or commodities in these commentaries is purely for illustrative purposes only and must not be construed as a recommendation, an offer or solicitation for the subscription, purchase or sale of the investment products or commodities mentioned. This advertisement has not been reviewed by the Monetary Authority of Singapore.

Singapore Airlines Benefits from Fuel Hedging Amid Jet Fuel Volatility, Maintains Market Position
Aviation Sector Performance and Fuel Dynamics Singapore's aviation sector delivered steady performance in June 2026, with SATS leading gains at 14.2%, followed by Singapore Airlines at 11.6% and SIA Engineering at 7.3%. Meanwhile, CAO declined 1.1%. The sector continues to navigate volatile jet fuel markets, with Singapore jet fuel prices currently trading at US$115 per barrel, down significantly from the March 2026 peak of US$240.5 per barrel following a US-Iran peace deal that reduced prices by approximately 50%. Singapore Airlines' Strategic Positioning Singapore Airlines has demonstrated resilience through its comprehensive hedging strategy and operational adaptability. The carrier maintains a dual hedge structure covering both Brent crude and jet fuel, with 35% hedging on jet fuel and 14% on Brent crude for the second quarter of FY2026/27. This positioning has provided relative insulation from fuel price volatility compared to unhedged competitors. The airline has capitalised on several market opportunities, including rerouted demand for Asia-Europe flights stopping over in Singapore due to regional conflicts. Additionally, Singapore Airlines benefits from rising cargo yields, with global freight rates increasing 41% year-on-year to US$3.40 per kilogram. The company's budget subsidiary, Scoot, has captured demand from regional low-cost carriers that grounded aircraft during the conflict period. Market Outlook and Competitive Landscape Despite current price reductions, jet fuel remains approximately 33% above the 2025 averages of US$90 per barrel. Regional carriers show varying degrees of hedging protection, with Singapore Airlines, Cathay Pacific, Japan Airlines, and ANA maintaining stronger hedged positions. Conversely, China's Big Three airlines—Air China, China Southern, and China Eastern—remain largely unhedged and face greater exposure to fuel price fluctuations. The cargo segment presents additional opportunities, as the partial grounding of Middle East airlines has removed significant capacity from India-Europe and China/Southeast Asia-Europe routes. This capacity reduction has pushed Asia-Europe spot rates to US$5.26 per kilogram in late June, representing a 38% year-on-year increase. While Singapore Airlines' cargo revenue exposure of 11% makes it a secondary beneficiary compared to carriers with higher cargo proportions, the company still stands to benefit from elevated rates. Analysts maintain a neutral stance on air transportation, given uncertain resolution of geopolitical conflicts and the potential for renewed fuel price volatility if ceasefires break down. Frequently Asked Questions [market_journal_faq] This article has been auto-generated using PhillipGPT. It is based on a report by a Phillip Securities Research analyst. Disclaimer These commentaries are intended for general circulation and do not have regard to the specific investment objectives, financial situation and particular needs of any person. Accordingly, no warranty whatsoever is given and no liability whatsoever is accepted for any loss arising whether directly or indirectly as a result of any person acting based on this information. You should seek advice from a financial adviser regarding the suitability of any investment product(s) mentioned herein, taking into account your specific investment objectives, financial situation or particular needs, before making a commitment to invest in such products. Opinions expressed in these commentaries are subject to change without notice. Investments are subject to investment risks including the possible loss of the principal amount invested. The value of units in any fund and the income from them may fall as well as rise. Past performance figures as well as any projection or forecast used in these commentaries are not necessarily indicative of future or likely performance. Phillip Securities Pte Ltd (PSPL), its directors, connected persons or employees may from time to time have an interest in the financial instruments mentioned in these commentaries. The information contained in these commentaries has been obtained from public sources which PSPL has no reason to believe are unreliable and any analysis, forecasts, projections, expectations and opinions (collectively the “Research”) contained in these commentaries are based on such information and are expressions of belief only. PSPL has not verified this information and no representation or warranty, express or implied, is made that such information or Research is accurate, complete or verified or should be relied upon as such. Any such information or Research contained in these commentaries are subject to change, and PSPL shall not have any responsibility to maintain the information or Research made available or to supply any corrections, updates or releases in connection therewith. In no event will PSPL be liable for any special, indirect, incidental or consequential damages which may be incurred from the use of the information or Research made available, even if it has been advised of the possibility of such damages. The companies and their employees mentioned in these commentaries cannot be held liable for any errors, inaccuracies and/or omissions howsoever caused. Any opinion or advice herein is made on a general basis and is subject to change without notice. The information provided in these commentaries may contain optimistic statements regarding future events or future financial performance of countries, markets or companies. You must make your own financial assessment of the relevance, accuracy and adequacy of the information provided in these commentaries. Views and any strategies described in these commentaries may not be suitable for all investors. Opinions expressed herein may differ from the opinions expressed by other units of PSPL or its connected persons and associates. Any reference to or discussion of investment products or commodities in these commentaries is purely for illustrative purposes only and must not be construed as a recommendation, an offer or solicitation for the subscription, purchase or sale of the investment products or commodities mentioned. This advertisement has not been reviewed by the Monetary Authority of Singapore.

Gold in 2026: Why Analysts Believe the Rally May Continue
Gold has emerged as one of the strongest-performing major asset classes, attracting investors seeking portfolio diversification and protection against economic uncertainty. After delivering exceptional returns in 2025, many market analysts continue to see upside potential for gold in 2026. Gold at a Glance Metric Value Spot Gold Price (11 June 2026) US$4,073/oz 2026 Peak Price US$5,595/oz J.P. Morgan Bull Case Target US$6,300/oz 2025 Return +60% These figures illustrate why gold remains one of the most discussed asset classes among investors. Ways to Invest in Gold Investors can gain exposure to gold through several investment vehicles, each offering different benefits and risks. Investment Type Suitable For Key Benefits Physical Gold Long-term holders Direct ownership Gold ETFs Most retail investors Low cost, easy trading Mining Stocks Growth investors Potentially higher returns Futures & CFDs Experienced traders Leveraged exposure Why Many Investors Prefer Gold ETFs Gold ETFs have become one of the easiest ways to invest in gold because they offer exposure to the price of gold without the need to buy, store, or insure physical bullion. The infographic compares US-listed Gold ETFs and highlights their management fees and fund sizes. The Investment Case for Gold Gold has historically been viewed as both a defensive asset and a portfolio diversifier. During periods of inflation, geopolitical uncertainty, or financial market volatility, investors often increase their allocations to gold. Why Investors Consider Gold Acts as a hedge against inflation Diversifies investment portfolios Preserves purchasing power over time Can perform well during market uncertainty Offers high global liquidity Should You Buy Physical Gold or Gold ETFs? For most retail investors, Gold ETFs offer several advantages: Feature Physical Gold Gold ETF Storage Required Yes No Easy to Trade Limited Yes Brokerage Account No Yes Liquidity Moderate High Ongoing Costs Storage & Insurance Management Fee Frequently Asked Questions [market_journal_faq] Disclaimer These commentaries are intended for general circulation and do not have regard to the specific investment objectives, financial situation and particular needs of any person. Accordingly, no warranty whatsoever is given and no liability whatsoever is accepted for any loss arising whether directly or indirectly as a result of any person acting based on this information. You should seek advice from a financial adviser regarding the suitability of any investment product(s) mentioned herein, taking into account your specific investment objectives, financial situation or particular needs, before making a commitment to invest in such products. Opinions expressed in these commentaries are subject to change without notice. Investments are subject to investment risks including the possible loss of the principal amount invested. The value of units in any fund and the income from them may fall as well as rise. Past performance figures as well as any projection or forecast used in these commentaries are not necessarily indicative of future or likely performance. Phillip Securities Pte Ltd (PSPL), its directors, connected persons or employees may from time to time have an interest in the financial instruments mentioned in these commentaries. The information contained in these commentaries has been obtained from public sources which PSPL has no reason to believe are unreliable and any analysis, forecasts, projections, expectations and opinions (collectively the “Research”) contained in these commentaries are based on such information and are expressions of belief only. PSPL has not verified this information and no representation or warranty, express or implied, is made that such information or Research is accurate, complete or verified or should be relied upon as such. Any such information or Research contained in these commentaries are subject to change, and PSPL shall not have any responsibility to maintain the information or Research made available or to supply any corrections, updates or releases in connection therewith. In no event will PSPL be liable for any special, indirect, incidental or consequential damages which may be incurred from the use of the information or Research made available, even if it has been advised of the possibility of such damages. The companies and their employees mentioned in these commentaries cannot be held liable for any errors, inaccuracies and/or omissions howsoever caused. Any opinion or advice herein is made on a general basis and is subject to change without notice. The information provided in these commentaries may contain optimistic statements regarding future events or future financial performance of countries, markets or companies. You must make your own financial assessment of the relevance, accuracy and adequacy of the information provided in these commentaries. Views and any strategies described in these commentaries may not be suitable for all investors. Opinions expressed herein may differ from the opinions expressed by other units of PSPL or its connected persons and associates. Any reference to or discussion of investment products or commodities in these commentaries is purely for illustrative purposes only and must not be construed as a recommendation, an offer or solicitation for the subscription, purchase or sale of the investment products or commodities mentioned. This advertisement has not been reviewed by the Monetary Authority of Singapore.

Singapore Equities Show Strong Momentum as AI Cycle Drives Growth, Banks and Semiconductors Favoured
Market Performance and Outlook Singapore equities have demonstrated robust performance, posting their fourth consecutive quarter of gains with a 5.8% rise in 2Q26. The market reached record highs on 25th June and was up 11.3% for the first half of 2026. The ceasefire in the Middle East has particularly benefited transportation stocks, whilst increased volatility supported exchanges and banking shares. Expectations of bottoming interest rates have further rallied banking stocks, though energy-related equities have faced pressure from sluggish oil and gas capital expenditure and falling energy prices. AI Investment Cycle: Booming Not Bubbling Phillip Securities Research maintains that current market conditions do not constitute an AI bubble. The firm identifies several key factors supporting this view. Massive AI and data centre capital expenditure by hyperscalers, including Oracle and Meta, is expected to rise 73% in 2026 and 22% in 2027, cascading into substantial semiconductor purchases with billings rising 86% year-to-date to reach an annualised US$1 trillion . Wafer fabrication capital expenditure is projected to jump 40% year-on-year to US$175 billion. The driving force behind this spending stems from frontier AI models, particularly Anthropic and OpenAI, whose combined revenue could total US$85 billion this year. Under an S-curve growth trajectory, revenue is expected to reach US$300 billion by 2030, justifying the capital expenditure spike. Current technology sector valuations remain significantly below dot-com bubble levels, with Nvidia trading at 24 times price-to-earnings compared to Cisco's peak of 150 times forward price-to-earnings in 2000. Investment Strategy and Sector Preferences The research house favours banks, semiconductors, building materials, power, and higher-yielding REITs. Banking stocks benefit from resilient dividend yields of around 4% and loan growth surging towards 8% year-on-year, a four-year high. A major spike in deposits following the Middle East conflict, with March recording a S$66 billion jump compared to the prior five-year monthly average of S$9 billion , should help lower funding costs. Semiconductor stocks are expected to register the fastest growth, fuelled by record demand from key equipment customers including ASML, Applied Materials, and Lam Research. In construction, whilst order momentum has slowed, activity has increased, supporting a 29% rise in ready-mixed concrete demand. Frequently Asked Questions [market_journal_faq] This article has been auto-generated using PhillipGPT. It is based on a report by a Phillip Securities Research analyst. Disclaimer These commentaries are intended for general circulation and do not have regard to the specific investment objectives, financial situation and particular needs of any person. Accordingly, no warranty whatsoever is given and no liability whatsoever is accepted for any loss arising whether directly or indirectly as a result of any person acting based on this information. You should seek advice from a financial adviser regarding the suitability of any investment product(s) mentioned herein, taking into account your specific investment objectives, financial situation or particular needs, before making a commitment to invest in such products. Opinions expressed in these commentaries are subject to change without notice. Investments are subject to investment risks including the possible loss of the principal amount invested. The value of units in any fund and the income from them may fall as well as rise. Past performance figures as well as any projection or forecast used in these commentaries are not necessarily indicative of future or likely performance. Phillip Securities Pte Ltd (PSPL), its directors, connected persons or employees may from time to time have an interest in the financial instruments mentioned in these commentaries. The information contained in these commentaries has been obtained from public sources which PSPL has no reason to believe are unreliable and any analysis, forecasts, projections, expectations and opinions (collectively the “Research”) contained in these commentaries are based on such information and are expressions of belief only. PSPL has not verified this information and no representation or warranty, express or implied, is made that such information or Research is accurate, complete or verified or should be relied upon as such. Any such information or Research contained in these commentaries are subject to change, and PSPL shall not have any responsibility to maintain the information or Research made available or to supply any corrections, updates or releases in connection therewith. In no event will PSPL be liable for any special, indirect, incidental or consequential damages which may be incurred from the use of the information or Research made available, even if it has been advised of the possibility of such damages. The companies and their employees mentioned in these commentaries cannot be held liable for any errors, inaccuracies and/or omissions howsoever caused. Any opinion or advice herein is made on a general basis and is subject to change without notice. The information provided in these commentaries may contain optimistic statements regarding future events or future financial performance of countries, markets or companies. You must make your own financial assessment of the relevance, accuracy and adequacy of the information provided in these commentaries. Views and any strategies described in these commentaries may not be suitable for all investors. Opinions expressed herein may differ from the opinions expressed by other units of PSPL or its connected persons and associates. Any reference to or discussion of investment products or commodities in these commentaries is purely for illustrative purposes only and must not be construed as a recommendation, an offer or solicitation for the subscription, purchase or sale of the investment products or commodities mentioned. This advertisement has not been reviewed by the Monetary Authority of Singapore.

ETF Monthly Outlook: Sideways Consolidation Expected Across Most Asset Classes in July 2026
Market Overview and Performance Summary The ETF market landscape presents a mixed picture heading into July 2026, with most major asset classes expected to enter periods of sideways consolidation following varied performance in June. According to the latest monthly analysis, investors should prepare for range-bound trading across several key exchange-traded funds tracking major indices and commodities. Asset Class Performance Analysis Equities showed divergent trends during June, with the Vanguard S&P 500 ETF (VOO) ending two consecutive months of gains with a 0.9% decline. The fund is expected to extend its sideways consolidation from June into July as markets digest recent moves. In contrast, Singapore equities demonstrated strength, with the SPDR Singapore Equities ETF (ES3) posting its third consecutive monthly gain of 3% in June, though analysts expect consolidation after the ETF reached target levels. Fixed income markets remained relatively stable, with the iShares 7-10 Year Treasury Bond ETF (IEF) trading flat during June. The bond ETF is anticipated to remain range-bound between US$93.40 and US$95.40 in July, extending a sideways consolidation pattern that has persisted since mid-March. Commodities faced significant headwinds, particularly in the precious metals sector. The SPDR Gold MiniShares Trust (GLDM) recorded its fourth consecutive monthly decline, tumbling 11.6% in June. Despite this weakness, analysts expect sideways consolidation in July, with support likely to hold at US$77.50 should the price retest the swing low from October 2025. Energy sector weakness continued, with the SPDR S&P Oil & Gas Exploration & Production ETF (XOP) falling 5.4% in June, marking its third consecutive monthly decline. The ETF is expected to consolidate sideways in July, with support anticipated in the US$148 to US$154 area. Notable Underperformers The cryptocurrency space showed particular vulnerability, with the ProShares Bitcoin Strategy ETF (BITO) tumbling 20.2% in June, marking its second consecutive monthly decline. Unlike other asset classes, Bitcoin ETFs are expected to continue their bearish trend in July, potentially retesting the US$7.44 swing low from August 2024, representing a 6.7% downside from current levels. Asian markets also faced pressure, with the Hang Seng China Enterprises Index ETF (2828) declining 9.6% in June for its second consecutive monthly drop. However, sideways consolidation is expected, with support between HKD$74.65 and HKD$77.10. Frequently Asked Questions [market_journal_faq] This article has been auto-generated using PhillipGPT. It is based on a report by a Phillip Securities Research analyst. Disclaimer These commentaries are intended for general circulation and do not have regard to the specific investment objectives, financial situation and particular needs of any person. Accordingly, no warranty whatsoever is given and no liability whatsoever is accepted for any loss arising whether directly or indirectly as a result of any person acting based on this information. You should seek advice from a financial adviser regarding the suitability of any investment product(s) mentioned herein, taking into account your specific investment objectives, financial situation or particular needs, before making a commitment to invest in such products. Opinions expressed in these commentaries are subject to change without notice. Investments are subject to investment risks including the possible loss of the principal amount invested. The value of units in any fund and the income from them may fall as well as rise. Past performance figures as well as any projection or forecast used in these commentaries are not necessarily indicative of future or likely performance. Phillip Securities Pte Ltd (PSPL), its directors, connected persons or employees may from time to time have an interest in the financial instruments mentioned in these commentaries. The information contained in these commentaries has been obtained from public sources which PSPL has no reason to believe are unreliable and any analysis, forecasts, projections, expectations and opinions (collectively the “Research”) contained in these commentaries are based on such information and are expressions of belief only. PSPL has not verified this information and no representation or warranty, express or implied, is made that such information or Research is accurate, complete or verified or should be relied upon as such. Any such information or Research contained in these commentaries are subject to change, and PSPL shall not have any responsibility to maintain the information or Research made available or to supply any corrections, updates or releases in connection therewith. In no event will PSPL be liable for any special, indirect, incidental or consequential damages which may be incurred from the use of the information or Research made available, even if it has been advised of the possibility of such damages. The companies and their employees mentioned in these commentaries cannot be held liable for any errors, inaccuracies and/or omissions howsoever caused. Any opinion or advice herein is made on a general basis and is subject to change without notice. The information provided in these commentaries may contain optimistic statements regarding future events or future financial performance of countries, markets or companies. You must make your own financial assessment of the relevance, accuracy and adequacy of the information provided in these commentaries. Views and any strategies described in these commentaries may not be suitable for all investors. Opinions expressed herein may differ from the opinions expressed by other units of PSPL or its connected persons and associates. Any reference to or discussion of investment products or commodities in these commentaries is purely for illustrative purposes only and must not be construed as a recommendation, an offer or solicitation for the subscription, purchase or sale of the investment products or commodities mentioned. This advertisement has not been reviewed by the Monetary Authority of Singapore.


