
Stock market crash
Table of Contents
Stock market crash
The stock market, which is frequently seen as a sign of economic success, represents the capacity for businesses to raise cash and for investors to get a return on their investments. The stock market does, however, have certain inherent dangers. Volatility and crashes can significantly negatively impact portfolios, causing significant financial losses for people, businesses, and even the economy as a whole.
From the great depression of the 1930s to the Dot-com Bubble of the early 2000s, history is rife with examples of stock market crashes and their terrible consequences. It is crucial to comprehend the risks related to the stock market because such calamities can have long-lasting effects that linger for years or even decades.
What is a stock market crash?
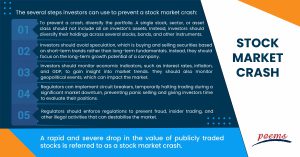
A rapid and severe drop in the value of publicly traded stocks is referred to as a stock market crash. The collapse typically happens when there is widespread panic selling by investors, which causes stock values to plummet significantly. Various circumstances, such as economic downturns, geopolitical unrest, shifts in investor mood, and problems with the systemic financial system, can cause stock markets. The economy may be affected in multiple ways by a stock market fall, including decreased employment, company investment, and consumer spending. It may also result in large financial losses for investors and businesses.
Understanding stock market crashes
Stock market crashes are complicated and often challenging to comprehend. Investors panic and sell off their holdings during a crash, driving down stock prices. This may trigger a vicious selling cycle in which many investors sell their shares. Stock market crashes can greatly affect the economy, leading to corporate failures, job losses, and a fall in consumer spending. Investors and governments must comprehend the causes and effects of stock market crashes.
Preventing a stock market crash
The several steps investors can use to prevent a stock market crash:
- To prevent a crash, diversify the portfolio. A single stock, sector, or asset class should not include all an investor’s assets. Instead, investors should diversify their holdings across several stocks, bonds, and other instruments.
- Investors should avoid speculation, which is buying and selling securities based on short-term trends rather than long-term fundamentals. Instead, they should focus on the long-term growth potential of a company.
- Investors should monitor economic indicators, such as interest rates, inflation, and GDP, to gain insight into market trends. They should also monitor geopolitical events, which can impact the market.
- Regulators can implement circuit breakers, temporarily halting trading during a significant market downturn, preventing panic selling and giving investors time to evaluate their positions.
- Regulators should enforce regulations to prevent fraud, insider trading, and other illegal activities that can destabilise the market.
Causes of a stock market crash
There are several reasons why a stock market crash can occur are:
- A stock market collapse can happen during a recession when companies and consumers have financial difficulties, resulting in a drop in demand for goods and services and a subsequent decline in stock prices.
- Interest rates may significantly impact the stock market. A decrease in the stock market might result from investors shifting their funds from stocks to bonds or other investments that give higher yields when interest rates rise.
- Speculation occurs when investors buy stocks hoping to make a quick profit rather than investing in a company’s long-term growth. If too many investors engage in speculation, it can lead to a bubble that eventually bursts, causing a crash.
- Corporate scandals, such as accounting fraud or insider trading, can cause investors to lose confidence in a company, leading to decreased stock prices.
- Geopolitical events, such as war or political instability, can cause uncertainty and volatility in the stock market, leading to a crash.
- Supply networks can be damaged by natural disasters like hurricanes, earthquakes, or pandemics, creating economic uncertainty and a drop in stock values.
- Sometimes stocks can become overvalued, meaning their prices are higher than their actual worth. This can occur when investors become overly optimistic about a company’s growth prospects, leading to a bubble that eventually bursts.
Examples of stock market crash
For example, the peak of the world financial crisis in 2008 saw a stock market meltdown. The crisis, which affected the entire global financial system, was caused by the subprime mortgage crisis in the United States.
Stock market losses were frequent due to investors’ growing scepticism over the dependability of banks and other financial organisations. Compared to its 2007 peak, the Dow Jones Industrial Average fell 33.8%, and some investors suffered substantial losses. While causing a global recession, the crisis demonstrated how intertwined the financial system is. Additionally, it compelled lawmakers to enact new rules intended to avert similar financial catastrophes in the future.
Frequently Asked Questions
While it is impossible to prevent a sudden market crash completely, some measures can help reduce the risk of such an event. These include implementing safeguards such as circuit breakers, improving transparency and oversight, and diversifying investments. Additionally, proactive risk management strategies can help investors and businesses mitigate the impacts of a potential crash.
Stock market crashes are typically characterised by rapid declines in stock prices, high levels of trading activity, and widespread panic among investors. Crashes can be triggered by various factors, including economic downturns, corporate scandals, and geopolitical events, and can significantly impact the broader economy.
History’s most famous stock market crashes include:
- The Wall Street crash of 1929
- The Black Monday crash of 1987
A circuit breaker is a regulatory mechanism designed to halt trading in a particular market in the event of significant price declines. When triggered, circuit breakers pause trading for a set period to allow investors to reassess their positions and prevent a complete market meltdown.
When a stock market crashes, investors experience significant financial losses as stock prices decline rapidly. This can lead to widespread panic and a sell-off of stocks, further exacerbating the decline. Businesses may also suffer, as declining stock prices can impact their ability to raise capital and access credit.
Related Terms
- Merger Arbitrage
- Intrinsic Value of Stock
- Callable Preferred Stock
- Growth Stocks
- Market maker
- Authorized Stock
- Dividend Discount Model
- Stock Shifts
- Seasoned Equity Offering
- Price to Book
- Stock Price
- Consumer Stock
- Undervalued Stocks
- Tracking Stock
- Income stocks
- Merger Arbitrage
- Intrinsic Value of Stock
- Callable Preferred Stock
- Growth Stocks
- Market maker
- Authorized Stock
- Dividend Discount Model
- Stock Shifts
- Seasoned Equity Offering
- Price to Book
- Stock Price
- Consumer Stock
- Undervalued Stocks
- Tracking Stock
- Income stocks
- Hang Seng Index
- Rally
- Ticker Symbol
- Defensive stock
- Earnings Guidance
- Wire house broker
- Stock Connect
- Options expiry
- Payment Date
- Treasury Stock Method
- Reverse stock splits
- Ticker
- Restricted strict unit
- Gordon growth model
- Stock quotes
- Shadow Stock
- Margin stock
- Dedicated Capital
- Whisper stock
- Voting Stock
- Deal Stock
- Microcap stock
- Capital Surplus
- Multi-bagger Stocks
- Shopped stock
- Secondary stocks
- Screen stocks
- Quarter stock
- Orphan stock
- One-decision stock
- Repurchase of stock
- Half stock
- Stock options
- Stock split
- Foreign exchange markets
- Stock Market
- FAANG stocks
- Unborrowable stock
- Joint-stock company
- Over-the-counter stocks
- Watered stock
- Zero-dividend preferred stock
- Bid price
- Authorised shares
- Auction markets
- Market capitalisation
- Arbitrage
- Market capitalisation rate
- Garbatrage
- Autoregressive
- Stockholder
- Penny stock
- Noncyclical Stocks
- Hybrid Stocks
- Large Cap Stocks
- Mid Cap Stocks
- Common Stock
- Preferred Stock
- Small Cap Stocks
- Earnings Per Share (EPS)
- Diluted Earnings Per Share
- Dividend Yield
- Cyclical Stock
- Blue Chip Stocks
- Averaging Down
Most Popular Terms
Other Terms
- Bond Convexity
- Compound Yield
- Brokerage Account
- Discretionary Accounts
- Industry Groups
- Growth Rate
- Green Bond Principles
- Gamma Scalping
- Funding Ratio
- Free-Float Methodology
- Foreign Direct Investment (FDI)
- Floating Dividend Rate
- Flight to Quality
- Real Return
- Protective Put
- Perpetual Bond
- Option Adjusted Spread (OAS)
- Non-Diversifiable Risk
- Liability-Driven Investment (LDI)
- Income Bonds
- Guaranteed Investment Contract (GIC)
- Flash Crash
- Equity Carve-Outs
- Cost of Equity
- Cost Basis
- Deferred Annuity
- Cash-on-Cash Return
- Earning Surprise
- Capital Adequacy Ratio (CAR)
- Bubble
- Beta Risk
- Bear Spread
- Asset Play
- Accrued Market Discount
- Ladder Strategy
- Junk Status
- Interest-Only Bonds (IO)
- Interest Coverage Ratio
- Inflation Hedge
- Industry Groups
- Incremental Yield
- Industrial Bonds
- Income Statement
- Holding Period Return
- Historical Volatility (HV)
- Hedge Effectiveness
- Flat Yield Curve
- Fallen Angel
- Exotic Options
- Execution Risk
Know More about
Tools/Educational Resources
Markets Offered by POEMS
Read the Latest Market Journal

What Are AI ETFs and Why Should You Care
A Beginner's Guide to Investing in the Artificial Intelligence Revolution Artificial intelligence is no longer science fiction. It powers the search results you browse; the fraud alerts your bank sends, and the recommendations on your streaming apps. This raises an important question: if AI is reshaping the global economy, should your investment portfolio reflect that? This article introduces the fundamentals of AI-themed Exchange-Traded Funds (ETFs), explaining what they are, why they matter, and how they can serve as an entry point into one of the most significant investment themes in today’s market. From Hype to Infrastructure When ChatGPT launched in late 2022, many viewed it as a novelty. By 2025, that novelty had evolved into necessity. AI now supports drug discovery in healthcare labs, quality control on factory floors, risk modelling in banks, and personalised shopping experiences online. This isn't a single-sector story — it's a cross-industry transformation. For investors, that breadth matters. It means AI-driven growth isn't dependent on one company or one industry succeeding. It's happening simultaneously across the global economy. The Problem with Picking Individual AI Stocks A common question is why not simply invest in leading AI companies such as Nvidia or Microsoft. The reality is that this approach is challenging, even for experienced investors. The AI landscape evolves rapidly, and today’s leaders may be displaced by future innovations. Companies that appear dominant may also face regulatory pressures, supply chain disruptions, or valuation corrections. Concentrating investments in a single stock amplifies these risks. This is precisely the challenge that ETFs are designed to address. What Is an ETF, and How Does It Help? An Exchange-Traded Fund is a basket of stocks that trades on a stock exchange, just like a single share. When you buy one unit of an AI ETF, you are effectively gaining exposure to a diversified group of companies involved in the AI ecosystem. The key benefits for everyday investors: Instant diversification across companies, sub-sectors, and even countries Lower capital requirements — you don't need to buy each stock individually Transparency — prices update throughout the trading day Competitive costs — AI ETFs typically charge between 0.30% and 0.75% annually in fees, far less than many managed funds Some ETFs are passively managed, meaning they track a published index of AI-related companies. Others are actively managed, where a professional team selects holdings based on research. The iShares AI Innovation and Tech Active ETF (BAI), for example, uses BlackRock's fundamental research team to pick what they believe are the most promising AI companies. The "Picks and Shovels" Principle During the California Gold Rush, the people who reliably made money weren't always the miners. Instead, it was the ones selling shovels, boots, and provisions. In AI, the modern equivalent of "picks and shovels" is semiconductors — the specialised chips that power AI models. Companies like Nvidia, TSMC, and AMD don't just benefit when one AI application succeeds; they benefit whenever any AI workload runs, anywhere in the world. Semiconductor ETFs like the VanEck Semiconductor ETF (SMH) or iShares Semiconductor ETF (SOXX) offer exposure to this infrastructure layer. SMH, for instance, holds over US$35 billion in assets and charges just 0.35% annually. A Snapshot of the AI ETF Landscape To give you a sense of how performance has varied across different approaches: ETF Focus 1-Year Return Expense Ratio Roundhill Generative AI ETF (CHAT) Generative AI 66.40% 0.75% WisdomTree AI & Innovation (WTAI) Broad AI 41.00% 0.45% VanEck Semiconductor (SMH) Semiconductors 71.54% 0.35% ROBO Global AI ETF (THNQ) Robotics & AI 25.97% 0.75% SPDR S&P 500 (SPY) Broad Market 14.75% 0.09% Data as of 26 March 2026. Past performance does not guarantee future results. The broader market, represented by the S&P 500 (SPY), delivered a return of 14.75%, which is solid by historical standards. Several AI-focused ETFs outperformed this benchmark. However, the variation in returns highlights an important point: not all AI ETFs behave in the same way, as they target different segments of the AI ecosystem. Risk Management is key No investment opportunity comes without trade-offs, and AI ETFs are no exception. Valuations can be stretched. Many AI companies trade at premium prices relative to their current earnings, meaning the market has already priced in a lot of future growth Concentration risk is real. Even "diversified" AI ETFs often have large weightings in just a few mega-cap names like Nvidia, Microsoft, and Alphabet. Geopolitical exposure matters. A significant portion of the world's most advanced chip manufacturing happens in Taiwan. Tensions in that region represent a real, if difficult to quantify, risk. The appropriate response is not to avoid AI altogether, but to size allocations prudently and maintain a long-term investment perspective. Key Takeaways AI has transitioned from a speculative theme to foundational economic infrastructure ETFs allow retail investors to participate without needing to pick individual winners The AI investment universe spans semiconductors, software, robotics, and more Costs, diversification, and ease of trading make ETFs an accessible starting point Like all investments, AI ETFs carry risk — and should form part of a broader, balanced portfolio Conclusion In summary, the AI revolution is not a trend to time precisely, but a structural shift to position for thoughtfully. For everyday investors, AI ETFs offer a practical and accessible way to participate in one of the most significant technological transformations in decades, without needing to predict which individual company will ultimately succeed. By diversifying exposure across semiconductors, software, and applied AI, investors can capture the breadth of the opportunity while reducing reliance on any single outcome. Starting with a measured allocation and building gradually over time can help manage risk effectively. The objective is not simply to chase returns, but to build a resilient portfolio that can grow alongside the technological changes shaping the global economy. Disclaimer These commentaries are intended for general circulation and do not have regard to the specific investment objectives, financial situation and particular needs of any person. Accordingly, no warranty whatsoever is given and no liability whatsoever is accepted for any loss arising whether directly or indirectly as a result of any person acting based on this information. You should seek advice from a financial adviser regarding the suitability of any investment product(s) mentioned herein, taking into account your specific investment objectives, financial situation or particular needs, before making a commitment to invest in such products. Opinions expressed in these commentaries are subject to change without notice. Investments are subject to investment risks including the possible loss of the principal amount invested. The value of units in any fund and the income from them may fall as well as rise. Past performance figures as well as any projection or forecast used in these commentaries are not necessarily indicative of future or likely performance. Phillip Securities Pte Ltd (PSPL), its directors, connected persons or employees may from time to time have an interest in the financial instruments mentioned in these commentaries. The information contained in these commentaries has been obtained from public sources which PSPL has no reason to believe are unreliable and any analysis, forecasts, projections, expectations and opinions (collectively the “Research”) contained in these commentaries are based on such information and are expressions of belief only. PSPL has not verified this information and no representation or warranty, express or implied, is made that such information or Research is accurate, complete or verified or should be relied upon as such. Any such information or Research contained in these commentaries are subject to change, and PSPL shall not have any responsibility to maintain the information or Research made available or to supply any corrections, updates or releases in connection therewith. In no event will PSPL be liable for any special, indirect, incidental or consequential damages which may be incurred from the use of the information or Research made available, even if it has been advised of the possibility of such damages. The companies and their employees mentioned in these commentaries cannot be held liable for any errors, inaccuracies and/or omissions howsoever caused. Any opinion or advice herein is made on a general basis and is subject to change without notice. The information provided in these commentaries may contain optimistic statements regarding future events or future financial performance of countries, markets or companies. You must make your own financial assessment of the relevance, accuracy and adequacy of the information provided in these commentaries. Views and any strategies described in these commentaries may not be suitable for all investors. Opinions expressed herein may differ from the opinions expressed by other units of PSPL or its connected persons and associates. Any reference to or discussion of investment products or commodities in these commentaries is purely for illustrative purposes only and must not be construed as a recommendation, an offer or solicitation for the subscription, purchase or sale of the investment products or commodities mentioned. This advertisement has not been reviewed by the Monetary Authority of Singapore.
Building a Strategic AI ETF Portfolio
A Practical Framework for Investors You've decided that AI deserves a place in your portfolio. Now comes the harder question: how much, where, and why? This article moves beyond the basics and into portfolio construction, examining the distinct categories of AI ETFs, how they complement each other, and how to build a coherent allocation that matches your risk tolerance and investment horizon. The Three Layers of the AI Ecosystem To construct a well balanced AI portfolio, it helps to think in layers. The AI value chain isn't monolithic — it runs from physical hardware all the way up to consumer-facing applications, and different ETFs target different layers. Layer 1 — Infrastructure (Hardware & Semiconductors) This is the foundation. AI models cannot run without specialised chips, data centres, and the energy to power them. Projections suggest the specialised chip market alone could reach $1 trillion by 2030, and US data centre power capacity may need to triple from 2023 levels by 2027 just to keep pace with AI demand. Representative ETFs: VanEck Semiconductor ETF (SMH), iShares Semiconductor ETF (SOXX) Layer 2 — Platform & Software (Broad AI Technology) Above the hardware sits the software, cloud platforms, and AI development tools. This includes companies building large language models, cloud services, and the APIs that allow businesses to deploy AI at scale. Representative ETFs: Global X AI & Technology ETF (AIQ), WisdomTree AI & Innovation Fund (WTAI), iShares Future AI & Tech ETF (ARTY) Layer 3 — Applications (Robotics, Automation, Sector-Specific AI) This is where AI is applied in the real world — intelligent robots on factory floors, autonomous vehicles, AI-powered medical devices. These companies often straddle technology and traditional industrial sectors, giving them a different risk-return profile. Representative ETFs: Global X Robotics & AI ETF (BOTZ), ROBO Global AI ETF (THNQ) A Tiered Allocation Framework A structured allocation approach may look as follows: Allocation Tier Suggested Weight Rationale Core Infrastructure (Semiconductors) 40–50% Foundational demand regardless of which AI apps win Growth (Broad AI Software & Platforms) 30–40% Captures the software layer and emerging applications Specialised Applications (Robotics etc.) 20–30% Physical AI with diversification into industrials The rationale is that infrastructure tends to be more defensible, as demand for semiconductors remains essential, while application-layer investments are typically higher conviction and more volatile. Understanding What You're Actually Buying Before investing in any ETF, it's worth examining its construction. Two ETFs labelled as “AI” may hold significantly different portfolios. Geographic exposure varies significantly. The Global X Robotics & AI ETF (BOTZ) holds roughly half its portfolio outside the United States, with meaningful exposure to Japanese robotics companies. SOXX, by contrast, is overwhelmingly US-focused. Neither is inherently better, but they carry different country-specific risks. Weighting methodology is another key consideration. Most large-cap ETFs are market-cap weighted, meaning larger companies get bigger allocations. The WisdomTree AI & Innovation Fund (WTAI) takes an equal-weighted approach instead, which reduces concentration in any single name and gives smaller companies more influence on returns. Active vs. passive management is a third variable. Passive ETFs like ARTY track a published index, providing predictability and lower fees. Active ETFs like BAI (iShares A.I. Innovation and Tech Active ETF) involve human judgement in stock selection, which can add value, but also introduces manager risk and typically higher costs. Risk Management: What Could Go Wrong? A well-constructed portfolio considers both potential upside and downside risks. Valuation risk is perhaps the most immediate concern. Many AI companies trade at significant premiums to their current earnings. If growth expectations disappoint — or if interest rates rise meaningfully — high-multiple stocks can correct sharply. Technological disruption cuts both ways. The same innovation engine driving AI growth can also make today's dominant companies obsolete. History suggests that in transformative technology cycles, the final winners aren't always the early leaders. Regulatory risk is growing. Governments worldwide are developing frameworks around data privacy, algorithmic transparency, and monopolistic behaviour in AI. Regulatory outcomes are inherently hard to predict, but likely to create meaningful divergence between winners and losers within the sector. Supply chain concentration remains a structural vulnerability. A disproportionate share of the world's most advanced chip fabrication is concentrated in Taiwan (primarily TSMC). This creates geopolitical risk that flows through many AI ETFs, regardless of where those ETFs are domiciled. The Bigger Picture: Portfolio Proportion AI ETFs should complement a diversified portfolio rather than replace it. Even with strong conviction in AI as a long-term theme, over-concentration exposes investors to correlated risks. Diversified holdings across equities, bonds, and other asset classes remain essential for managing volatility and preserving long-term returns. A practical approach is to treat AI ETFs as a thematic or growth allocation within the broader portfolio, sized according to individual risk tolerance and overall investment objectives. In conclusion, building a strategic AI ETF portfolio is ultimately an exercise in intellectual honesty about what you know, what you do not know, and how much volatility you can realistically tolerate when markets turn. The framework outlined here should be viewed as a starting point rather than a fixed prescription. As the AI landscape evolves, some segments will exceed expectations, while others may fall short, and entirely new sub-themes are likely to emerge over time. The investors best positioned to benefit are unlikely to be those who made the boldest calls early on, but those who built diversified and cost-efficient portfolios, rebalanced with discipline, and avoided over-concentration during periods of heightened enthusiasm. In a theme as dynamic as AI, process is just as important as conviction. Key Takeaways The AI ecosystem has three distinct layers — infrastructure, software platforms, and applied applications — each with different risk and return characteristics A tiered allocation (40/30/30 or similar) can balance defensive infrastructure plays with higher-growth application bets ETF construction details — geographic exposure, weighting methodology, active vs. passive — matter as much as the fund's label Risk management requires planning for valuation corrections, disruption, regulation, and supply chain vulnerabilities AI ETFs works best as a component of a diversified portfolio, sized to your risk tolerance Disclaimer These commentaries are intended for general circulation and do not have regard to the specific investment objectives, financial situation and particular needs of any person. Accordingly, no warranty whatsoever is given and no liability whatsoever is accepted for any loss arising whether directly or indirectly as a result of any person acting based on this information. You should seek advice from a financial adviser regarding the suitability of any investment product(s) mentioned herein, taking into account your specific investment objectives, financial situation or particular needs, before making a commitment to invest in such products. Opinions expressed in these commentaries are subject to change without notice. Investments are subject to investment risks including the possible loss of the principal amount invested. The value of units in any fund and the income from them may fall as well as rise. Past performance figures as well as any projection or forecast used in these commentaries are not necessarily indicative of future or likely performance. Phillip Securities Pte Ltd (PSPL), its directors, connected persons or employees may from time to time have an interest in the financial instruments mentioned in these commentaries. The information contained in these commentaries has been obtained from public sources which PSPL has no reason to believe are unreliable and any analysis, forecasts, projections, expectations and opinions (collectively the “Research”) contained in these commentaries are based on such information and are expressions of belief only. PSPL has not verified this information and no representation or warranty, express or implied, is made that such information or Research is accurate, complete or verified or should be relied upon as such. Any such information or Research contained in these commentaries are subject to change, and PSPL shall not have any responsibility to maintain the information or Research made available or to supply any corrections, updates or releases in connection therewith. In no event will PSPL be liable for any special, indirect, incidental or consequential damages which may be incurred from the use of the information or Research made available, even if it has been advised of the possibility of such damages. The companies and their employees mentioned in these commentaries cannot be held liable for any errors, inaccuracies and/or omissions howsoever caused. Any opinion or advice herein is made on a general basis and is subject to change without notice. The information provided in these commentaries may contain optimistic statements regarding future events or future financial performance of countries, markets or companies. You must make your own financial assessment of the relevance, accuracy and adequacy of the information provided in these commentaries. Views and any strategies described in these commentaries may not be suitable for all investors. Opinions expressed herein may differ from the opinions expressed by other units of PSPL or its connected persons and associates. Any reference to or discussion of investment products or commodities in these commentaries is purely for illustrative purposes only and must not be construed as a recommendation, an offer or solicitation for the subscription, purchase or sale of the investment products or commodities mentioned. This advertisement has not been reviewed by the Monetary Authority of Singapore.

How CFDs Complement Your Trading and Investing Strategies
How CFDs Complement Your Trading and Investing Strategies In today’s fast-moving financial markets, investors and traders are constantly seeking ways to improve their strategies and capture to new opportunities. Contracts for Difference (CFDs) have become a popular tool because they offer flexibility, access to global markets, and the ability to trade both rising and falling prices. However, CFDs are complex, leveraged products that carry a higher level of risk and may not be suitable for all investors. What Are CFDs? A Contract for Difference (CFD) is a derivative product that allows you to participate in the price movement of an asset without owning the underlying assets.1 Instead of purchasing the asset, you initiate an agreement with a CFD broker to settle the difference between the opening and closing prices of your position. CFDs also allow you to trade a variety of asset classes within a single account, making them a flexible and versatile tool for enhancing both trading and investing strategies. How CFDs Complement Trading Strategies? For traders, CFDs provide opportunities that may not always be available in traditional markets. Their flexibility and fast execution make them well suited for short-term strategies such as day trading, swing trading, and scalping. Leverage for Capital Efficiency CFDs allow traders to improve their capital efficiency as they are traded on margin. This means traders can initiate positions with a smaller initial capital outlay. As a result, this increases accessibility to financial markets, especially for those with limited capital. However, leverage also amplifies losses, making proper risk management essential,2 which we will explore in more detail later. Example: If a trader wants to gain exposure to shares worth US$10,000, using 10:1 leverage they would only need to provide US$1,000 as margin. By applying proper risk management, such as limiting the trade to a small portion of total capital and using stop-loss orders, potential losses can be controlled while still benefiting from leverage. Positioning for Rising or Falling Markets One notable advantage of CFDs is the ability to short sell. This enables traders to manage their positions and potentially generate profits or mitigate losses during periods of market decline. Downward movements can be especially pronounced during risk-off phases, and CFDs offer flexibility for traders to adopt either long or short positions. When market sentiment turns negative, sharp declines in price may occur, presenting opportunities for traders seeking to capitalize on strong, short-term momentum. With the ability to short sell through CFDs, traders can take advantage of these downward moves rather than missing potential opportunities when markets drop.3 Access to Multiple Global Market When trading CFDs, traders can access multiple global markets through a single trading account rather than opening separate accounts for each market4. As global markets operate across different time zones, this access allows traders to participate in markets at various times throughout the day. This creates a more continuous flow of opportunities, particularly during periods of heightened volatility. How CFDs Complement Investing Strategies? CFDs are often associated with short-term trading. However, when structured effectively, they can enhance long-term investing strategies. They are not meant to replace traditional investing, instead, they act as a strategic tool to improve flexibility, capital efficiency, and risk management. 1) Adding Tactical Opportunities to a Portfolio Long-term investors build portfolios based on strategic asset allocation, selecting quality investments to hold for several years and benefit from sustained market growth. However, markets do not move in a straight line, and short-term volatility can arise from economic data releases, sector forward narrative, and global events. CFDs offer a way for investors to take advantage of these shorter-term market movements without altering their core long-term holdings. 2) Hedging Long-Term Positions Hedging is a risk management strategy that involves taking positions designed to offset potential losses in an existing investment portfolio5. Market volatility is an unavoidable part of investing. Unexpected events such as economic uncertainty, geopolitical developments, and changes in interest rates may include a financial shock, triggering market corrections. These occurrences can disrupt market stability and lead to significant fluctuations in asset prices. Instead of selling long-term holdings during periods of uncertainty, investors can use CFDs to hedge their exposure. For example, if an investor holds a portfolio of technology stocks and expects short-term market weakness, they may open a short CFD position on technology stock or index. If the market declines, the losses in the portfolio may be partially offset by gains from the CFD position. This allows investors to manage short-term downside risk while continuing to hold their long-term investments6. 3) Capital Efficiency and Diversification Unlike traditional investing, CFDs require only margin rather than the full capital outlay of the underlying asset. This allows investors to gain market exposure while keeping more capital available for other opportunities. In addition, CFDs provide new investment opportunities beyond traditional exchange-traded products such as foreign exchange (FX), global indices, and commodities. This allows long-term investors to broaden their exposure to different asset classes without trading directly in those markets7. As financial markets move rapidly, opportunities may arise unexpectedly. If capital is fully committed to long-term positions, investors may miss these opportunities. By incorporating CFDs, investors can maintain greater flexibility while continuing to participate in the markets. Key Considerations: Risks of Trading CFDs CFDs are leveraged financial instruments and carry a higher level of risk compared to traditional investments. Even small price movements in the underlying asset can have a significant impact on a trader’s position. As a result, both gains and losses are magnified. Therefore, it is important for investors and traders to understand the potential risks and apply proper risk management when trading CFDs8. Leverage Risk – Leverage allows traders to control larger positions with less capital, but it can also amplify losses and the losses may exceed initial capital if the market moves against the trade. Market Volatility – Sudden market movements caused by economic news or geopolitical events can lead to rapid price changes and unexpected losses. Margin Call Risk – If account equity falls below the required margin level, traders may need to add funds or risk having positions forced closed. Overnight Financing Costs – Holding CFD positions overnight may incur financing charges, which can affect overall profitability. Mitigating Risks and Best Practices To manage these risks effectively, traders should adopt disciplined practices: traders should set stop-loss and take-profit levels to define clear exit points9 and conservative position sizes, diversify across various markets and asset classes, and monitor positions regularly. New traders are advised to start with smaller trades or demo accounts to gain experience, as well as periodically review and adjust strategies to respond to changing market conditions. Conclusion CFDs are versatile financial instruments that can add value to both trading and investing strategies. For traders, they offer provide ease of trade, leverage, and the ability to profit in rising or falling markets. For investors, CFDs can enhance portfolio flexibility, support hedging strategies, and flexibility in managing portfolios. Whether you are seeking to capture short-term opportunities or manage long-term portfolio risks, CFDs can serve as a valuable tool within a broader financial strategy. When used responsibly, they can help bridge the gap between active trading and long-term wealth accumulation. Promotion Start your CFD journey with us and enjoy 0 commission on US equity CFDs for 30 days when you open a CFD account with us. In addition, receive S$50 cash credit when you fund and trade. As long as you open a POEMS CFD Account during the promotion period of 10 March 2026 to 10 June 2026 (both dates inclusive) and do NOT have any existing POEMS CFD Account(s), your 0 commission on US Equity CFDs for 30 days will be active upon receiving an email notification to indicate promotion has been activated for the account. For more information, you can visit our CFD website or click here References: Understanding contracts for difference. (n.d.). https://www.moneysense.gov.sg/understanding-contracts-for-difference/ MarketMates. (2024, August 13). Trading 101: Leverage and margin explained. https://marketmates.com/learn/cfd-trading/trading-101-leverage-and-margin-explained/ Phillip CFD. (2021a, March 16). What is Short-Selling? | CFD Trading Singapore | Phillip CFD. https://www.phillipcfd.com/products/what-is-short-selling/ What is CFD trading – a beginner’s guide. (2026, January 12). TradingView. https://www.tradingview.com/news/forexlive:704a82432094b:0-what-is-cfd-trading-a-beginner-sguide/#:~:text=Types%20of%20CFD%20Markets,%2C%20and%20Ripple%20(XRP) Popular hedging Strategies for traders in 2025 for FXOPEN:EURUSD by FXOpen. (2025, March 19). TradingView. https://www.tradingview.com/chart/EURUSD/oeOYrKIr-Popular-Hedging-Strategies-for-Traders-in-2025/ Hedging in Share Market | Types of Hedging Strategies in Trading. (n.d.). https://www.truedata.in/blog/hedging-in-share-market? Gratton, P. (2025, August 28). Understanding Contract for Differences (CFDs): Key insights and benefits. Investopedia. https://www.investopedia.com/articles/stocks/09/trade-a-cfd.asp What is CFD trading – a beginner’s guide. (2026b, January 12). TradingView. https://www.tradingview.com/news/forexlive:704a82432094b:0-what-is-cfd-trading-a-beginner-s-guide/ Gratton, P. (2025b, August 28). Understanding Contract for Differences (CFDs): Key insights and benefits. Investopedia https://www.investopedia.com/articles/stocks/09/trade-a-cfd.asp Disclaimer These commentaries are intended for general circulation and do not have regard to the specific investment objectives, financial situation and particular needs of any person. Accordingly, no warranty whatsoever is given and no liability whatsoever is accepted for any loss arising whether directly or indirectly as a result of any person acting based on this information. You should seek advice from a financial adviser regarding the suitability of any investment product(s) mentioned herein, taking into account your specific investment objectives, financial situation or particular needs, before making a commitment to invest in such products. Opinions expressed in these commentaries are subject to change without notice. Investments are subject to investment risks including the possible loss of the principal amount invested. The value of units in any fund and the income from them may fall as well as rise. Past performance figures as well as any projection or forecast used in these commentaries are not necessarily indicative of future or likely performance. Phillip Securities Pte Ltd (PSPL), its directors, connected persons or employees may from time to time have an interest in the financial instruments mentioned in these commentaries. The information contained in these commentaries has been obtained from public sources which PSPL has no reason to believe are unreliable and any analysis, forecasts, projections, expectations and opinions (collectively the “Research”) contained in these commentaries are based on such information and are expressions of belief only. PSPL has not verified this information and no representation or warranty, express or implied, is made that such information or Research is accurate, complete or verified or should be relied upon as such. Any such information or Research contained in these commentaries are subject to change, and PSPL shall not have any responsibility to maintain the information or Research made available or to supply any corrections, updates or releases in connection therewith. In no event will PSPL be liable for any special, indirect, incidental or consequential damages which may be incurred from the use of the information or Research made available, even if it has been advised of the possibility of such damages. The companies and their employees mentioned in these commentaries cannot be held liable for any errors, inaccuracies and/or omissions howsoever caused. Any opinion or advice herein is made on a general basis and is subject to change without notice. The information provided in these commentaries may contain optimistic statements regarding future events or future financial performance of countries, markets or companies. You must make your own financial assessment of the relevance, accuracy and adequacy of the information provided in these commentaries. Views and any strategies described in these commentaries may not be suitable for all investors. Opinions expressed herein may differ from the opinions expressed by other units of PSPL or its connected persons and associates. Any reference to or discussion of investment products or commodities in these commentaries is purely for illustrative purposes only and must not be construed as a recommendation, an offer or solicitation for the subscription, purchase or sale of the investment products or commodities mentioned. This advertisement has not been reviewed by the Monetary Authority of Singapore.

Q&M Dental Group Poised for Major Expansion Through Strategic Acquisitions
Company Overview Q&M Dental Group Ltd operates as a dental services provider with a current network of more than 150 standalone clinics in Singapore and Malaysia. The company is positioning itself to become a major dental franchise platform through strategic acquisitions and organic growth initiatives. Ambitious Acquisition Strategy The company has announced three significant proposed acquisitions totalling approximately S$272 million, which could potentially double its earnings upon completion. These acquisitions span across Australia, Singapore, and Thailand, backed by robust profit guarantees totalling S$200 million over five to eight years. The largest acquisition involves an Australian dental network valued at A$144.5 million (approximately S$130 million), comprising more than 40 clinics and 120 dentists. This will be complemented by additional Singapore clinic acquisitions and a Thai operation focused on cosmetic and aesthetic dentistry with over 30 clinics. Financing Structure and Growth Projections The acquisitions will be financed through a combination of cash and shares, following the Australian acquisition template where 40% of the purchase consideration will be satisfied through shares issued at S$0.70. Notably, the structure includes a 15-year moratorium on shares and service agreements to ensure vendor alignment with long-term objectives. The profit guarantees provide embedded earnings growth of approximately 14% per annum over the next three years. These acquisitions are expected to boost FY26 estimated earnings per share by 80% to 3.5 cents. Operational Synergies and Network Expansion The expanded network will create opportunities for revenue and cost synergies, alongside the implementation of best practices in marketing, advanced dentistry, and operations. The company aims to aggressively grow the Australian network towards 400 clinics over five years, whilst targeting 300 dental clinics across Singapore over the same period. The broader network will also serve as a platform for rolling out EM2AI solutions. Financial Performance and Outlook FY25 revenue exceeded expectations at 105% with the consolidation of Aoxin Q&M, though net profit came in at 68% due to S$2.4 million in interest expenses and S$2 million in one-off costs. Additional government subsidies for restorative dental procedures introduced in October contributed a 3% boost to Singapore revenue in the second half of FY25. Phillip Securities Research Recommendation Phillip Securities Research maintains a BUY recommendation with a raised target price of S$0.71 (previously S$0.545). The fair value post-acquisition is estimated at S$0.95, though a 50% discount has been applied pending completion of the acquisitions. The valuation is pegged at 25x PE FY26, in line with the Singapore healthcare sector. Frequently Asked Questions Q: What is the total value of Q&M Dental's proposed acquisitions? A: The three proposed acquisitions have an estimated total value of S$272 million, covering dental operations in Australia, Singapore, and Thailand. Q: How will these acquisitions be financed? A: The acquisitions will be satisfied through a combination of cash and shares, with 40% of the purchase consideration in shares issued at S$0.70, following the Australian acquisition template. Q: What are the profit guarantees associated with these acquisitions? A: The acquisitions are backed by profit guarantees totalling S$200 million over five to eight years, providing embedded earnings growth of approximately 14% per annum for the next three years. Q: What is Phillip Securities Research's recommendation and target price? A: Phillip Securities Research maintains a BUY recommendation with a raised target price of S$0.71, up from the previous target of S$0.545. Q: How many clinics does Q&M currently operate and what are its expansion plans? A: Q&M currently operates more than 150 clinics in Singapore and Malaysia and aims to grow towards 300 dental clinics in Singapore and 400 clinics in Australia over the next five years. Q: What impact will the acquisitions have on earnings? A: The acquisitions are estimated to boost FY26 earnings per share by 80% to 3.5 cents, with the potential to double the company's overall earnings upon completion. Q: What operational benefits are expected from the acquisitions? A: The expanded network will create opportunities for revenue and cost synergies, implementation of best practices in marketing and operations, and serve as a platform for rolling out EM2AI solutions across the broader clinic network. This article has been auto-generated using PhillipGPT. It is based on a report by a Phillip Securities Research analyst. Disclaimer These commentaries are intended for general circulation and do not have regard to the specific investment objectives, financial situation and particular needs of any person. Accordingly, no warranty whatsoever is given and no liability whatsoever is accepted for any loss arising whether directly or indirectly as a result of any person acting based on this information. You should seek advice from a financial adviser regarding the suitability of any investment product(s) mentioned herein, taking into account your specific investment objectives, financial situation or particular needs, before making a commitment to invest in such products. Opinions expressed in these commentaries are subject to change without notice. Investments are subject to investment risks including the possible loss of the principal amount invested. The value of units in any fund and the income from them may fall as well as rise. Past performance figures as well as any projection or forecast used in these commentaries are not necessarily indicative of future or likely performance. Phillip Securities Pte Ltd (PSPL), its directors, connected persons or employees may from time to time have an interest in the financial instruments mentioned in these commentaries. The information contained in these commentaries has been obtained from public sources which PSPL has no reason to believe are unreliable and any analysis, forecasts, projections, expectations and opinions (collectively the “Research”) contained in these commentaries are based on such information and are expressions of belief only. PSPL has not verified this information and no representation or warranty, express or implied, is made that such information or Research is accurate, complete or verified or should be relied upon as such. Any such information or Research contained in these commentaries are subject to change, and PSPL shall not have any responsibility to maintain the information or Research made available or to supply any corrections, updates or releases in connection therewith. In no event will PSPL be liable for any special, indirect, incidental or consequential damages which may be incurred from the use of the information or Research made available, even if it has been advised of the possibility of such damages. The companies and their employees mentioned in these commentaries cannot be held liable for any errors, inaccuracies and/or omissions howsoever caused. Any opinion or advice herein is made on a general basis and is subject to change without notice. The information provided in these commentaries may contain optimistic statements regarding future events or future financial performance of countries, markets or companies. You must make your own financial assessment of the relevance, accuracy and adequacy of the information provided in these commentaries. Views and any strategies described in these commentaries may not be suitable for all investors. Opinions expressed herein may differ from the opinions expressed by other units of PSPL or its connected persons and associates. Any reference to or discussion of investment products or commodities in these commentaries is purely for illustrative purposes only and must not be construed as a recommendation, an offer or solicitation for the subscription, purchase or sale of the investment products or commodities mentioned. This advertisement has not been reviewed by the Monetary Authority of Singapore.

Micron Technology Reports Record Quarterly Performance Amid Strategic Shifts
Company Overview Micron Technology, Inc is a leading global semiconductor company specialising in memory and storage solutions, including DRAM and NAND flash memory products that are essential components in various electronic devices and data centres. Strong Financial Performance Drives Optimism Micron Technology has delivered exceptional financial results for the second quarter of fiscal year 2026, with adjusted profit after tax and minority interests (PATMI) surging 686% year-on-year to a record US$14 billion. This remarkable performance was driven by substantial bit shipment growth of approximately 35% year-on-year, combined with significant increases in average selling prices (ASPs) for both DRAM and NAND memory products, which rose an estimated 107% and 118% respectively. The company's revenue performance aligned with analyst expectations, with first-half fiscal 2026 revenue representing 50% of the full-year forecast. Meanwhile, the adjusted PATMI exceeded expectations, accounting for 58% of the annual projection, indicating strong momentum in the business. Strategic Customer Agreements Signal Market Evolution A significant development for Micron has been the establishment of its first five-year strategic customer agreement (SCA) with an undisclosed large customer. This represents a notable shift from the company's traditional approach of securing long-term agreements that typically last only one year. The move reflects the evolving landscape in the semiconductor industry, where high-end chipmakers and hyperscalers increasingly view memory as strategically critical in the artificial intelligence race, leading to longer-term contractual commitments across the sector. Market Outlook and Geopolitical Considerations Phillip Securities Research maintains a BUY recommendation with an upgraded target price of US$530, increased from the previous US$500. The research house has raised its fiscal 2026 revenue and PATMI forecasts by 43% and 100% respectively, citing an ongoing industry shortage in memory chips that is expected to continue pushing DRAM and NAND ASPs higher. However, the analysis incorporates geopolitical risk factors, particularly concerns about potential disruptions from Middle East conflicts. The research notes that closure of the Straits of Hormuz could threaten 30% of global helium supply, a critical component in semiconductor wafer manufacturing. Micron is considered better positioned than Korean competitors due to its stronger presence in the United States, which accounts for approximately 45% of global helium production compared to Qatar's 30%. Frequently Asked Questions Q: What drove Micron's record quarterly performance? A: The record US$14 billion adjusted PATMI was driven by bit shipment growth of approximately 35% year-on-year and significant increases in DRAM and NAND average selling prices, which rose an estimated 107% and 118% respectively. Q: How significant is Micron's new strategic customer agreement? A: This is Micron's first five-year strategic customer agreement, representing a major shift from traditional long-term agreements that typically last only one year, reflecting the strategic importance of memory in the AI race. Q: What is Phillip Securities Research's recommendation and target price? A: Phillip Securities Research maintains a BUY recommendation with a target price of US$530, upgraded from the previous US$500. Q: How much did analysts raise their forecasts? A: Phillip Securities Research’s analysts raised fiscal 2026 revenue forecasts by 43% and PATMI forecasts by 100%. Q: What supply outlook does the research anticipate? A: Industry supply is expected to increase meaningfully starting from the second half of calendar year 2027, as SK Hynix aims to maintain its 2026 capital expenditure-to-sales ratio at approximately mid-30% level. Q: What geopolitical risks affect Micron? A: Potential closure of the Straits of Hormuz could threaten 30% of global helium supply, critical for semiconductor manufacturing, though Micron is considered better positioned than Korean competitors due to stronger US presence. Q: How does Micron's geographic positioning help with supply chain risks? A: Micron benefits from stronger presence in the United States, which accounts for about 45% of global helium production compared to Qatar's 30%, providing better insulation from Middle East conflicts than Korean competitors. This article has been auto-generated using PhillipGPT. It is based on a report by a Phillip Securities Research analyst. Disclaimer These commentaries are intended for general circulation and do not have regard to the specific investment objectives, financial situation and particular needs of any person. Accordingly, no warranty whatsoever is given and no liability whatsoever is accepted for any loss arising whether directly or indirectly as a result of any person acting based on this information. You should seek advice from a financial adviser regarding the suitability of any investment product(s) mentioned herein, taking into account your specific investment objectives, financial situation or particular needs, before making a commitment to invest in such products. Opinions expressed in these commentaries are subject to change without notice. Investments are subject to investment risks including the possible loss of the principal amount invested. The value of units in any fund and the income from them may fall as well as rise. Past performance figures as well as any projection or forecast used in these commentaries are not necessarily indicative of future or likely performance. Phillip Securities Pte Ltd (PSPL), its directors, connected persons or employees may from time to time have an interest in the financial instruments mentioned in these commentaries. The information contained in these commentaries has been obtained from public sources which PSPL has no reason to believe are unreliable and any analysis, forecasts, projections, expectations and opinions (collectively the “Research”) contained in these commentaries are based on such information and are expressions of belief only. PSPL has not verified this information and no representation or warranty, express or implied, is made that such information or Research is accurate, complete or verified or should be relied upon as such. Any such information or Research contained in these commentaries are subject to change, and PSPL shall not have any responsibility to maintain the information or Research made available or to supply any corrections, updates or releases in connection therewith. In no event will PSPL be liable for any special, indirect, incidental or consequential damages which may be incurred from the use of the information or Research made available, even if it has been advised of the possibility of such damages. The companies and their employees mentioned in these commentaries cannot be held liable for any errors, inaccuracies and/or omissions howsoever caused. Any opinion or advice herein is made on a general basis and is subject to change without notice. The information provided in these commentaries may contain optimistic statements regarding future events or future financial performance of countries, markets or companies. You must make your own financial assessment of the relevance, accuracy and adequacy of the information provided in these commentaries. Views and any strategies described in these commentaries may not be suitable for all investors. Opinions expressed herein may differ from the opinions expressed by other units of PSPL or its connected persons and associates. Any reference to or discussion of investment products or commodities in these commentaries is purely for illustrative purposes only and must not be construed as a recommendation, an offer or solicitation for the subscription, purchase or sale of the investment products or commodities mentioned. This advertisement has not been reviewed by the Monetary Authority of Singapore.

Singapore REITs Show Resilience Despite February Decline
Market Performance and Sector Overview Singapore Real Estate Investment Trusts (S-REITs) experienced a modest setback in February 2026, with the S-REITs Index declining 1.9% after posting a 0.7% gain in January. This correction reflects broader market volatility amid ongoing geopolitical tensions and monetary policy uncertainty. The S-REITs sector encompasses a diverse portfolio of real estate investments, including retail properties in Singapore and commercial assets overseas. These investment vehicles provide investors with exposure to income-generating real estate across multiple geographic markets and property types, offering regular dividend distributions and portfolio diversification benefits. Individual REIT Performance Performance varied significantly across individual REITs during February. Stoneweg Europe Stapled Trust emerged as the standout performer, surging 6.9% following strong full-year 2025 results. Conversely, Prime US REIT faced headwinds, declining 12.9% after the previous month's 14.2% rally, as investors reassessed the pace of occupancy recovery within its portfolio. Sub-sector performance also diverged notably. Singapore retail REITs led gains with a 0.8% increase, demonstrating the resilience of domestic retail properties. However, overseas commercial properties struggled, particularly US office S-REITs, which contributed to an 8% decline in the overseas commercial sub-sector. Interest Rate Environment and Growth Prospects Despite inflationary pressures stemming from Middle East geopolitical tensions and Federal Reserve expectations of maintaining elevated interest rates, analysts identify potential catalysts for stronger distribution per unit growth in financial year 2026. The continued decline in benchmark Singapore Overnight Rate Average rates is expected to generate meaningful interest cost savings for S-REITs, supporting improved financial performance. Investment Outlook and Recommendations Phillip Securities Research maintains an OVERWEIGHT recommendation on S-REITs, citing their stable performance and defensive characteristics as attractive features for global investors navigating market uncertainty. The sector's valuation metrics remain compelling, trading at a forward dividend yield spread of approximately 3.8% and a price-to-net asset value ratio of 0.97 times. Within sub-sectors, retail properties are favoured due to expectations of strong rental reversions in the high single digits throughout 2026. Overseas S-REITs offering yields exceeding 8% with resilient portfolios are also preferred, including specific recommendations for Stoneweg Europe Stapled Trust with a target price of €1.89, Elite UK REIT at £0.41, United Hampshire US REIT at US$0.69, and Prime US REIT at US$0.32. Frequently Asked Questions Q: What was the performance of Singapore REITs in February 2026? A: The S-REITs Index fell 1.9% in February 2026, reversing the 0.7% gain recorded in January 2026. Q: Which REIT was the best performer in February and why? A: Stoneweg Europe Stapled Trust was the top performer, rising 6.9% on strong FY25 results. Q: What is Phillip Securities Research's overall recommendation on S-REITs? A: Phillip Securities Research maintains an OVERWEIGHT recommendation on S-REITs due to their stable performance and defensive positioning. Q: Which sub-sectors are preferred and why? A: Retail is preferred due to expected strong rental reversions in the high single digits in 2026, and overseas S-REITs offering high yields over 8% with resilient portfolios are also favoured. Q: What are the key target prices mentioned in the report? A: Target prices include Stoneweg Europe Stapled Trust at €1.89, Elite UK REIT at £0.41, United Hampshire US REIT at US$0.69, and Prime US REIT at US$0.32. Q: What factors support potential DPU growth in FY26? A: Interest cost savings from declining benchmark SORA rates are expected to support stronger distribution per unit growth in FY26. Q: How are S-REITs currently valued? A: The sector trades at a forward dividend yield spread of approximately 3.8% and a price-to-net asset value ratio of 0.97 times, which are considered undemanding valuations. Q: What challenges does the sector face? A: The sector faces inflation concerns from heightened geopolitical tensions in the Middle East and expectations that the Federal Reserve will maintain higher-for-longer interest rates. This article has been auto-generated using PhillipGPT. It is based on a report by a Phillip Securities Research analyst. Disclaimer These commentaries are intended for general circulation and do not have regard to the specific investment objectives, financial situation and particular needs of any person. Accordingly, no warranty whatsoever is given and no liability whatsoever is accepted for any loss arising whether directly or indirectly as a result of any person acting based on this information. You should seek advice from a financial adviser regarding the suitability of any investment product(s) mentioned herein, taking into account your specific investment objectives, financial situation or particular needs, before making a commitment to invest in such products. Opinions expressed in these commentaries are subject to change without notice. Investments are subject to investment risks including the possible loss of the principal amount invested. The value of units in any fund and the income from them may fall as well as rise. Past performance figures as well as any projection or forecast used in these commentaries are not necessarily indicative of future or likely performance. Phillip Securities Pte Ltd (PSPL), its directors, connected persons or employees may from time to time have an interest in the financial instruments mentioned in these commentaries. The information contained in these commentaries has been obtained from public sources which PSPL has no reason to believe are unreliable and any analysis, forecasts, projections, expectations and opinions (collectively the “Research”) contained in these commentaries are based on such information and are expressions of belief only. PSPL has not verified this information and no representation or warranty, express or implied, is made that such information or Research is accurate, complete or verified or should be relied upon as such. Any such information or Research contained in these commentaries are subject to change, and PSPL shall not have any responsibility to maintain the information or Research made available or to supply any corrections, updates or releases in connection therewith. In no event will PSPL be liable for any special, indirect, incidental or consequential damages which may be incurred from the use of the information or Research made available, even if it has been advised of the possibility of such damages. The companies and their employees mentioned in these commentaries cannot be held liable for any errors, inaccuracies and/or omissions howsoever caused. Any opinion or advice herein is made on a general basis and is subject to change without notice. The information provided in these commentaries may contain optimistic statements regarding future events or future financial performance of countries, markets or companies. You must make your own financial assessment of the relevance, accuracy and adequacy of the information provided in these commentaries. Views and any strategies described in these commentaries may not be suitable for all investors. Opinions expressed herein may differ from the opinions expressed by other units of PSPL or its connected persons and associates. Any reference to or discussion of investment products or commodities in these commentaries is purely for illustrative purposes only and must not be construed as a recommendation, an offer or solicitation for the subscription, purchase or sale of the investment products or commodities mentioned. This advertisement has not been reviewed by the Monetary Authority of Singapore.

Wee Hur Holdings Upgraded to Buy on Strong Performance and Growth Prospects
Company Overview Wee Hur Holdings Ltd is a Singapore-based company operating across three key business segments: worker dormitory operations, building construction, and property development. The company has established itself as a significant player in Singapore's infrastructure and accommodation sectors, with substantial dormitory assets and a growing construction order book. Strong Financial Performance Drives Upgrade Phillip Securities Research has upgraded Wee Hur Holdings to BUY from NEUTRAL, raising the target price to S$1.08 from S$0.90 previously. This upgrade follows exceptional 2H25 results that significantly exceeded expectations, with revenue and adjusted PATMI reaching 114% and 138% of full-year forecasts respectively. The company's adjusted PATMI surged 81% year-on-year to S$50 million in 2H25, driven by multiple growth catalysts across its business segments. The strong performance reflects successful execution of the company's diversified business model and strategic positioning in Singapore's infrastructure development. Worker Dormitory Business Anchors Growth The worker dormitory segment delivered robust performance, with Tuas View Dormitory achieving 95% occupancy compared to 93% in FY24, alongside positive rental revisions of approximately 5% year-on-year. The segment benefited significantly from Pioneer Lodge's Phase 1 operations, which added 3,088 beds representing a 20% capacity increase since May 2025. This expansion drove dormitory revenue up 21% year-on-year to S$50.8 million in 2H25. Pioneer Lodge's Phase 2, comprising 7,412 beds and representing a 39% capacity increase, received its temporary occupancy permit in 4Q25 and is expected to contribute to occupancy ramp-up in FY26. Construction Segment Shows Marked Improvement The building construction segment demonstrated remarkable turnaround, with revenue spiking 172% year-on-year to S$50 million in 2H25. Operating margins improved substantially by 10 percentage points year-on-year to -7% in FY25, compared to -17% in FY24. This improvement was driven by higher recognition of external projects, which now comprise 99% of the company's S$673 million order book, up from 59% previously. The expanded order book, growing from S$263 million in FY24, is expected to support construction segment growth through 4Q29. Strategic Portfolio Adjustments The research firm's sum-of-the-parts valuation model reflects strategic portfolio changes, including the removal of Mega@Woodlands property development and the addition of Wee Hur's 50% stake in the S$614 million Upper Thomson Road GLS site. The model also incorporates the company's estimated 20% stake in the 344-key DoubleTree by Hilton hotel and Fund III, backed by a 708-bed Australia PBSA. Future Outlook With major construction projects including Changi Airport Terminal 5 and Marina Bay Sands Integrated Resort on the horizon, analysts expect Wee Hur's 15,744-bed Tuas View Dormitory lease to be extended beyond November 2026, providing continued revenue visibility for the dormitory business. Frequently Asked Questions Q: What is Phillip Securities Research's current recommendation and target price for Wee Hur Holdings? A: Phillip Securities Research has upgraded Wee Hur Holdings to BUY from NEUTRAL, with a higher target price of S$1.08, increased from the previous target of S$0.90. Q: How did Wee Hur's 2H25 results compare to expectations? A: The company's 2H25 revenue and adjusted PATMI significantly exceeded expectations, reaching 114% and 138% of full-year forecasts respectively, with adjusted PATMI surging 81% year-on-year to S$50 million. Q: What drove the strong performance in the worker dormitory segment? A: The dormitory segment benefited from Tuas View Dormitory's improved occupancy rate of 95% and positive rental revisions of about 5% year-on-year, plus contributions from Pioneer Lodge Phase 1's additional 3,088 beds, driving dormitory revenue up 21% year-on-year to S$50.8 million. Q: How has the building construction segment's profitability changed? A: The building construction segment's operating margins improved significantly by 10 percentage points year-on-year to -7% in FY25, compared to -17% in FY24, driven by higher recognition of external projects and an expanded order book. Q: What is the current size and composition of Wee Hur's construction order book? A: The company's construction order book stands at S$673 million, up from S$263 million in FY24, with external projects now comprising 99% of the order book compared to 59% previously. This order book is expected to support growth through 4Q29. Q: When will Pioneer Lodge Phase 2 contribute to operations? A: Pioneer Lodge Phase 2, comprising 7,412 beds and representing a 39% capacity increase, received its temporary occupancy permit in 4Q25 and is expected to ramp up occupancy in FY26. Q: What major construction projects could benefit Wee Hur's dormitory business? A: Major upcoming construction projects including Changi Airport Terminal 5 and Marina Bay Sands Integrated Resort are expected to support the extension of Wee Hur's 15,744-bed Tuas View Dormitory lease beyond November 2026. Q: What changes were made to the valuation model? A: The sum-of-the-parts model removed Mega@Woodlands property development and included Wee Hur's 50% stake in the S$614 million Upper Thomson Road GLS site, plus the company's estimated 20% stake in the 344-key DoubleTree by Hilton hotel and Fund III backed by a 708-bed Australia PBSA. This article has been auto-generated using PhillipGPT. It is based on a report by a Phillip Securities Research analyst. Disclaimer These commentaries are intended for general circulation and do not have regard to the specific investment objectives, financial situation and particular needs of any person. Accordingly, no warranty whatsoever is given and no liability whatsoever is accepted for any loss arising whether directly or indirectly as a result of any person acting based on this information. You should seek advice from a financial adviser regarding the suitability of any investment product(s) mentioned herein, taking into account your specific investment objectives, financial situation or particular needs, before making a commitment to invest in such products. Opinions expressed in these commentaries are subject to change without notice. Investments are subject to investment risks including the possible loss of the principal amount invested. The value of units in any fund and the income from them may fall as well as rise. Past performance figures as well as any projection or forecast used in these commentaries are not necessarily indicative of future or likely performance. Phillip Securities Pte Ltd (PSPL), its directors, connected persons or employees may from time to time have an interest in the financial instruments mentioned in these commentaries. The information contained in these commentaries has been obtained from public sources which PSPL has no reason to believe are unreliable and any analysis, forecasts, projections, expectations and opinions (collectively the “Research”) contained in these commentaries are based on such information and are expressions of belief only. PSPL has not verified this information and no representation or warranty, express or implied, is made that such information or Research is accurate, complete or verified or should be relied upon as such. Any such information or Research contained in these commentaries are subject to change, and PSPL shall not have any responsibility to maintain the information or Research made available or to supply any corrections, updates or releases in connection therewith. In no event will PSPL be liable for any special, indirect, incidental or consequential damages which may be incurred from the use of the information or Research made available, even if it has been advised of the possibility of such damages. The companies and their employees mentioned in these commentaries cannot be held liable for any errors, inaccuracies and/or omissions howsoever caused. Any opinion or advice herein is made on a general basis and is subject to change without notice. The information provided in these commentaries may contain optimistic statements regarding future events or future financial performance of countries, markets or companies. You must make your own financial assessment of the relevance, accuracy and adequacy of the information provided in these commentaries. Views and any strategies described in these commentaries may not be suitable for all investors. Opinions expressed herein may differ from the opinions expressed by other units of PSPL or its connected persons and associates. Any reference to or discussion of investment products or commodities in these commentaries is purely for illustrative purposes only and must not be construed as a recommendation, an offer or solicitation for the subscription, purchase or sale of the investment products or commodities mentioned. This advertisement has not been reviewed by the Monetary Authority of Singapore.

TeleChoice International Ltd Maintains Growth Trajectory with Strong FY25 Performance
Company Overview TeleChoice International Ltd is a telecommunications services provider focused on personal communications systems (PCS) and network engineering services. The company operates across Southeast Asia, with significant exposure to Malaysia's telecommunications market through its partnership with U-Mobile. Financial Performance Exceeds Expectations TeleChoice delivered FY25 results that met analyst forecasts, with revenue and profit after tax and minority interests (PATMI) reaching 105% and 103% of expectations respectively. Revenue expanded substantially by 27% year-on-year to S$276 million, primarily supported by U-Mobile 4PL services. However, adjusted PATMI grew at a more modest 20% year-on-year to S$4.4 million due to inventory provisioning impacts. Shareholders benefited from a significant dividend increase, with FY25 dividends more than tripling to 0.45 cents. Personal Communications System Drives Growth The personal communications system segment remained the company's primary growth engine, with revenue surging 42% year-on-year to S$200 million. This impressive growth was fuelled by U-Mobile's expanding subscriber base and the increasing adoption of higher-value postpaid plans requiring handset subsidies. TeleChoice strategically expanded its retail footprint by increasing outlet numbers, broadening its device portfolio, and introducing additional accessories to capture greater market share. Challenges and Outlook Despite the strong revenue performance, TeleChoice faced headwinds from higher inventory provisions. The company experienced a significant spike in inventory write-downs, with provisions increasing by S$2.5 million to S$3.8 million. This provisioning was attributed to a S$11 million year-on-year rise in inventory levels during FY25, compared to S$9.3 million in FY24. Research Recommendation and Valuation Phillip Securities Research maintains its BUY recommendation on TeleChoice International, raising the target price to S$0.275 from the previous S$0.215. The firm increased its FY26e PATMI forecast by 13% to S$8.3 million. The valuation is based on a 15x price-to-earnings multiple for FY26e, benchmarked against SGX-listed companies in the system integration and software sectors. The research house noted that growth momentum in PCS remains intact, with network engineering showing signs of recovery through managed services and network buildout projects in Indonesia and Malaysia. Additionally, TeleChoice is evaluating expansion opportunities into higher-growth digital infrastructure segments, including data centres. Frequently Asked Questions Q: What were TeleChoice's key financial results for FY25? A: TeleChoice achieved revenue of S$276 million, representing 27% year-on-year growth, and adjusted PATMI of S$4.4 million, up 20% year-on-year. Results were within expectations at 105% and 103% of forecasts respectively. Q: Which business segment drove the strongest growth? A: The personal communications system (PCS) segment was the key growth driver, with revenue jumping 42% year-on-year to S$200 million, supported by U-Mobile subscriber growth and higher postpaid plans. Q: What challenges did the company face during FY25? A: TeleChoice experienced higher inventory provisions, with write-downs increasing by S$2.5 million to S$3.8 million due to a S$11 million year-on-year rise in inventory levels. Q: What is Phillip Securities Research's recommendation and target price? A: Phillip Securities Research maintains a BUY recommendation with a raised target price of S$0.275, up from the previous S$0.215, based on 15x P/E for FY26e. Q: How did dividends perform in FY25? A: FY25 dividends more than tripled to 0.45 cents, representing a 260% increase from the previous year's 0.125 cents. Q: What expansion opportunities is TeleChoice considering? A: The company announced it is evaluating expansion into higher-growth segments within digital infrastructure, including data centres, whilst network engineering is recovering through managed services and projects in Indonesia and Malaysia. Q: What factors contributed to the PCS segment's strong performance? A: Growth was driven by U-Mobile 5G subscribers, additional retail stores, postpaid handset subsidies, a widening range of devices, and expanded accessories offerings. This article has been auto-generated using PhillipGPT. It is based on a report by a Phillip Securities Research analyst. Disclaimer These commentaries are intended for general circulation and do not have regard to the specific investment objectives, financial situation and particular needs of any person. Accordingly, no warranty whatsoever is given and no liability whatsoever is accepted for any loss arising whether directly or indirectly as a result of any person acting based on this information. You should seek advice from a financial adviser regarding the suitability of any investment product(s) mentioned herein, taking into account your specific investment objectives, financial situation or particular needs, before making a commitment to invest in such products. Opinions expressed in these commentaries are subject to change without notice. Investments are subject to investment risks including the possible loss of the principal amount invested. The value of units in any fund and the income from them may fall as well as rise. Past performance figures as well as any projection or forecast used in these commentaries are not necessarily indicative of future or likely performance. Phillip Securities Pte Ltd (PSPL), its directors, connected persons or employees may from time to time have an interest in the financial instruments mentioned in these commentaries. The information contained in these commentaries has been obtained from public sources which PSPL has no reason to believe are unreliable and any analysis, forecasts, projections, expectations and opinions (collectively the “Research”) contained in these commentaries are based on such information and are expressions of belief only. PSPL has not verified this information and no representation or warranty, express or implied, is made that such information or Research is accurate, complete or verified or should be relied upon as such. Any such information or Research contained in these commentaries are subject to change, and PSPL shall not have any responsibility to maintain the information or Research made available or to supply any corrections, updates or releases in connection therewith. In no event will PSPL be liable for any special, indirect, incidental or consequential damages which may be incurred from the use of the information or Research made available, even if it has been advised of the possibility of such damages. The companies and their employees mentioned in these commentaries cannot be held liable for any errors, inaccuracies and/or omissions howsoever caused. Any opinion or advice herein is made on a general basis and is subject to change without notice. The information provided in these commentaries may contain optimistic statements regarding future events or future financial performance of countries, markets or companies. You must make your own financial assessment of the relevance, accuracy and adequacy of the information provided in these commentaries. Views and any strategies described in these commentaries may not be suitable for all investors. Opinions expressed herein may differ from the opinions expressed by other units of PSPL or its connected persons and associates. Any reference to or discussion of investment products or commodities in these commentaries is purely for illustrative purposes only and must not be construed as a recommendation, an offer or solicitation for the subscription, purchase or sale of the investment products or commodities mentioned. This advertisement has not been reviewed by the Monetary Authority of Singapore.


