Volatility
Table of Contents
Volatility
Volatility is a gauge of how much an asset’s price changes over time. Volatility is not necessarily bad because it may occasionally present entry possibilities for investors to profit from. Investors who are certain that markets will outperform in the long run can purchase more shares of their favorite firms at a discount.
A straightforward illustration might be that an investor can purchase a stock for 100 USD that was previously valued at 200 USD. This kind of stock acquisition decreases your average cost-per-share, which aids in improving the performance of your portfolio when markets ultimately recover.
The most critical thing to remember is that market volatility shouldn’t be used to determine whether or not you should abandon your investment because market volatility is natural.
Investors can take advantage of the investment opportunities that volatility presents to improve long-term returns by comprehending volatility and its causes.
What is volatility?
Volatility is a metric of how much a security’s price, such as a stock or a commodity, fluctuates over time. It is frequently employed as a risk indicator, as investors are typically more risk-averse and demand a higher return for investing in more volatile assets.
Investors are affected by volatility in several ways.
- Firstly, it can impact the value of their investments, as prices can go up or down very quickly. This can significantly influence portfolio values and make it challenging to anticipate future returns with accuracy.
- Secondly, volatility can also impact the costs of investing, as transaction costs are typically higher for more volatile assets. This can eat into returns and make it more difficult to generate profits.
Why is volatility important?
Volatility is an important factor for investors to consider when making investment decisions. Understanding how it functions and employing it in your investing plan is crucial.
The danger increases as volatility increases. Investors considering investing in stock will look at the volatility to determine its risk. A stock with high volatility is more likely to fluctuate in price and is riskier.
Different types of volatility
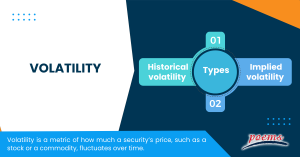
Volatility can be divided into two categories: historical and implied.
- Historical volatility
Historical volatility measures how much an asset has fluctuated in the past. It is also called statistical volatility.
The price of an investment will fluctuate more than usual when historical volatility increases. There is current anticipation that something will change or already has. On the other hand, if historical volatility declines, it indicates that all uncertainty has been removed and things have returned to normal.
Although this estimate may rely on intraday fluctuations, it frequently gauges move as the difference between two closing prices. Historical volatility could be calculated in steps of 10 to 180 trading days, depending on the anticipated length of the options transaction.
- Implied volatility
Implied volatility measures how much an asset is expected to fluctuate.
As the name implies, it enables investors to estimate the future volatility of the market. Traders can calculate probabilities using this approach. One thing to remember is that it should not be viewed as a science. Thus, it can’t predict how well the market will act in the future.
Contrary to historical volatility, implied volatility, which reflects predictions for future volatility, is derived from an option’s intrinsic value. Traders cannot use previous performance as a sign of future performance since it is implied. Instead, they must predict the option’s market potential.
Measures of volatility
Volatility measures the range in which a stock’s price may rise or fall, and is calculated as the standard deviation of a stock’s annualized returns over a certain time.
Volatility can generally be calculated in both absolute and relative terms.
- Absolute volatility
Absolute volatility is measured in percentage terms and how much an asset has fluctuated over a given period.
- Relative volatility
Relative volatility measures how much an asset has fluctuated relative to another asset.
Volatility and options pricing
Volatility is a key factor in options pricing. The price of the option increases with increasing volatility. Volatility is also a measure of how frequently the price of the underlying asset changes. It is frequently employed as a risk indicator. Higher volatility entails greater risk and cost.
Even in the absence of actual price movement, volatility increases the value of calls and puts. Due to this, volatility is crucial. Most traders know how to use options whenever the market is predicted to rise or fall.
Frequently Asked Questions
Market volatility is the fluctuation of prices in the market. It is the degree to which the prices of assets in the market move up and down.
In terms of statistics, volatility is the annualized return standard deviation of a market or investment over a certain period or the pace at which its price rises or falls.
Stock market volatility is the fluctuations that occur in the prices of stocks. Several factors, including economic news, company earnings, and global events, can cause these fluctuations. While some investors see volatility as a risk, others see it as an opportunity to make quick profits.
The simplest definition of volatility is the amount of fluctuation in share prices. Share values swing wildly up and down during volatile times but smoothly and predictably during less volatile times. Conversely, the risk is the possibility of an investment’s value dropping.
Volatility measures the range in which a stock’s price may rise or fall and is calculated as the standard deviation of a stock’s annualized returns over a certain time. A stock is considered to possess high volatility if its price experiences large swings between recent highs and lows in a brief period.
Several factors can contribute to stock price volatility. These include economic indicators, political events, and even natural disasters. When investors are uncertain about the future, they tend to buy fewer shares, leading to price volatility. Additionally, when there is a lot of buying or selling activity in a short period, this can also cause prices to fluctuate.
Related Terms
- International securities exchanges
- Margin Requirement
- Pledged Asset
- Stochastic Oscillator
- Prepayment risk
- Homemade leverage
- Prime bank investments
- ESG
- Capitulation
- Shareholder service fees
- Insurable Interest
- Minority Interest
- Passive Investing
- Market cycle
- Progressive tax
- Correlation
- NFT
- Carbon credits
- Hyperinflation
- Hostile takeover
- Travel insurance
- Money market
- Dividend investing
- Digital Assets
- Coupon yield
- Counterparty
- Sharpe ratio
- Alpha and beta
- Investment advisory
- Wealth management
- Variable annuity
- Asset management
- Value of Land
- Investment Policy
- Investment Horizon
- Forward Contracts
- Equity Hedging
- Encumbrance
- Money Market Instruments
- Share Market
- Opening price
- Transfer of Shares
- Alternative investments
- Lumpsum
- Derivatives market
- Operating assets
- Hypothecation
- Accumulated dividend
- Assets under management
- Endowment
- Return on investment
- Investments
- Acceleration clause
- Heat maps
- Lock-in period
- Tranches
- Stock Keeping Unit
- Real Estate Investment Trusts
- Prospectus
- Turnover
- Tangible assets
- Preference Shares
- Open-ended investment company
- Standard deviation
- Independent financial adviser
- ESG investing
- Earnest Money
- Primary market
- Leveraged Loan
- Transferring assets
- Shares
- Fixed annuity
- Underlying asset
- Quick asset
- Portfolio
- Mutual fund
- Xenocurrency
- Bitcoin Mining
- Option contract
- Depreciation
- Inflation
- Cryptocurrency
- Options
- Asset
- Reinvestment option
- Capital appreciation
- Style Box
- Top-down Investing
- Trail commission
- Unit holder
- Yield curve
- Rebalancing
- Vesting
- Private equity
- Bull Market
- Absolute Return
- Leaseback
- Impact investing
- Venture Capital
- Buy limit
- Asset stripper
- Investment objective
- Annuity
- Sustainable investing
- Face-amount certificate
- Lipper ratings
- Investment stewardship
- Average accounting return
- Asset class
- Active management
- Breakpoint
- Expense ratio
- Bear market
- Annualised rate of return
- Hedging
- Equity options
- Dollar-Cost Averaging (DCA)
- Due Diligence
- Contrarian Investor
Most Popular Terms
Other Terms
- Settlement currency
- Federal funds rate
- Active Tranche
- Convertible Securities
- Synthetic ETF
- Physical ETF
- Initial Public Offering
- Buyback
- Secondary Sharing
- Bookrunner
- Notional amount
- Negative convexity
- Jumbo pools
- Inverse floater
- Forward Swap
- Underwriting risk
- Reinvestment risk
- Final Maturity Date
- Payment Date
- Secondary Market
- Mark-to-market
- Yield Pickup
- Subordinated Debt
- Trailing Stops
- Treasury Stock Method
- Bullet Bonds
- Basket Trade
- Contrarian Strategy
- Exchange Control
- Notional Value
- Relevant Cost
- Dow Theory
- Speculation
- Stub
- Trading Volume
- Going Long
- Pink sheet stocks
- Rand cost averaging
- Sustainable investment
- Stop-limit sell order
- Economic Bubble
- Ask Price
- Constant prepayment rate
- Covenants
- Stock symbol
- Companion tranche
- Synthetic replication
- Bourse
- Beneficiary
- Witching Hour
Know More about
Tools/Educational Resources
Markets Offered by POEMS
Read the Latest Market Journal

Navigating the vast world of unit trusts can be daunting. With nearly 2000 funds available...

Predicting Trend Reversals with Candlestick Patterns for Beginners
Candlestick patterns are used to predict the future direction of price movements as they contain...

In the diverse and complex world of investing, unit trusts stand out as a popular...

Back in Business: The Return of IPOs & Top Traded Counters in March 2024
Start trading on POEMS! Open a free account here! At a glance: Major indices continue...

Weekly Updates 15/4/24 – 19/4/24
This weekly update is designed to help you stay informed and relate economic and company...

From $50 to $100: Unveiling the Impact of Inflation
In recent years, inflation has become a hot topic, evoking strong emotions as the cost...

Japan’s Economic Resurgence: Unveiling the Tailwinds Behind Nikkei 225’s Record Leap
Source: eSignal, Intercontinental Exchange, Inc. In the heart of Japan’s economic landscape, the Nikkei 225...

Weekly Updates 8/4/24 – 12/4/24
This weekly update is designed to help you stay informed and relate economic and...


