Being Bullish
Table of Contents
Being Bullish
Markets go through upswings and downswings in cycles. Pessimism denotes bearishness, whereas optimism represents bullish individuals, markets, and behaviours. A trader who has a bullish attitude believes that the price of securities will increase.
What does it mean to be bullish?
To be bullish is to have an optimistic outlook on the future. It means to be confident in the prospects for growth and to believe that prices will continue to rise. When someone is bullish on the market, they buy in anticipation of future gains. Bullish investors are typically optimistic about economic conditions and believe corporate earnings will continue to grow.
Based on their research, bullish traders anticipate that a market will see an increase in price movement. Going long, or being bullish, is purchasing an underlying market to sell it later on for a profit once the price has increased.
Understanding what bullish means
A bullish investor anticipates price increases for one or more assets or indexes. This is true regardless of market magnitude. A bullish investor may think the market will rise and anticipate gains.
In other situations, a shareholder may project profits in a particular sector, stock, bond, commodity, or collectable. An investor who is, let’s say, optimistic about ABC Corp. believes that the stock of that particular firm will increase.
If you were bullish, you would purchase the market. Both investments in the primary market and trading on its value are options for achieving this. By default, most investors will be positive since they become the asset’s owners by purchasing shares (or other assets) and must rely on market growth to realise a return.
With financial derivatives like CFDs and spread bets, traders may predict a market’s value growth. These products let users speculate on an asset’s price changes without purchasing it, allowing for negative positions.
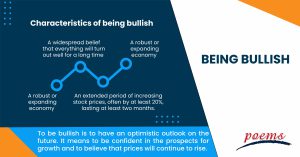
Characteristics of being bullish
When investors are bullish, they buy in anticipation of future price increases. This can create a self-fulfilling prophecy, as buying activity drives prices up. A bullish market is typically seen as a sign of a healthy economy.
Bull market characteristics include:
- An extended period of increasing stock prices, often by at least 20%, lasting at least two months.
- A robust or expanding economy
- High investor optimism and investor confidence
- A widespread belief that everything will turn out well for a long time
An example of being bullish
In the financial world, a “bull” is an optimistic investor about the market and believes that prices will rise. For example, let’s say that Company XYZ is about to release its quarterly earnings. A bullish analyst on the company’s prospects might say that the stock is a “buy” and that the earnings report will be positive.
The strong increase in US technology equities in the latter part of the 1990s is one of the greatest illustrations of a bull market. The Nasdaq Index rose by a staggering 400% between 1995 and its apex in March 2000.
Unfortunately, during the next few months, the Nasdaq fell by about 80%, effectively wiping out all of the profits achieved during the bullish run.
What is a bullish trend?
A market’s movement in one direction is referred to as a “trend” in the financial markets. A “bullish trend” is an upwards trend in stock prices within a particular sector or a general increase in broad market indexes characterised by a high level of investor optimism.
The bulls’ strong purchasing pressure is what defines the bullish trend. A bullish trend is recognised if there is a price increase of roughly 20%.
Frequently Asked Questions
If you are bullish, you will buy the market. Both investments in the underlying marketplace and trading on its price are options for achieving this. By default, most investors will be positive since they become the asset’s owners by purchasing shares (or other assets) and must rely on market growth to realise a return.
Many bullish indicators can be used to predict future market direction, but some are more reliable than others. The best bullish indicator is the Relative Strength Index (RSI), which measures the strength of a stock’s recent price performance.
The stock is overbought when the RSI exceeds 70 and may be due for a pullback. However, the stock is oversold when the RSI exceeds 30 and may be due for a rebound.
There are several techniques to identify bullish stocks, but the key is to seek companies displaying strength. Searching for stocks and setting new 52-week highs is one way to achieve this. This shows that the stock is in a significant uptrend and is most likely to keep rising.
Search for equities trading above their moving averages since this is another technique to identify positive securities. This is just another proof that the stock is experiencing a robust upswing.
Finally, you can look for stocks with strong fundamentals, such as a low P/E ratio or a high dividend yield. These stocks are usually more resistant to sell-offs and are more likely to continue moving higher over the long term.
When a negative market having a downward trend starts to move in the other direction, it is known as a bullish reversal.
Bullish confirmation is necessary for the majority of bullish reversal formations. In other words, they must be accompanied by an upward price movement, which may be represented by a gap up or a long hollow candlestick followed by a significant amount of trade volume. Three days after, the pattern should be watched for this confirmation.
A bull trap is a decreasing trend in an index, stock, or any other investment that reverses following a compelling rise and breaches a previous support level. This is a misleading signal.
Traders should watch out for “bull traps” during downturns in the market. A short-term rebound during a decline which “traps” the bulls, who believed it to be the beginning of a new upswing, is referred to as a bull trap. In weak markets, short-term rallies are rather frequent.
Related Terms
- Trailing Stops
- Exchange Control
- Relevant Cost
- Dow Theory
- Hyperdeflation
- Hope Credit
- Futures contracts
- Human capital
- Subrogation
- Qualifying Annuity
- Strategic Alliance
- Probate Court
- Procurement
- Holding company
- Harmonic mean
- Trailing Stops
- Exchange Control
- Relevant Cost
- Dow Theory
- Hyperdeflation
- Hope Credit
- Futures contracts
- Human capital
- Subrogation
- Qualifying Annuity
- Strategic Alliance
- Probate Court
- Procurement
- Holding company
- Harmonic mean
- Income protection insurance
- Recession
- Savings Ratios
- Pump and dump
- Total Debt Servicing Ratio
- Debt to Asset Ratio
- Liquid Assets to Net Worth Ratio
- Liquidity Ratio
- Personal financial ratios
- T-bills
- Payroll deduction plan
- Operating expenses
- Demand elasticity
- Deferred compensation
- Conflict theory
- Acid-test ratio
- Withholding Tax
- Benchmark index
- Double Taxation Relief
- Debtor Risk
- Securitization
- Yield on Distribution
- Currency Swap
- Overcollateralization
- Efficient Frontier
- Listing Rules
- Green Shoe Options
- Accrued Interest
- Market Order
- Accrued Expenses
- Target Leverage Ratio
- Acceptance Credit
- Balloon Interest
- Abridged Prospectus
- Data Tagging
- Perpetuity
- Hybrid annuity
- Investor fallout
- Intermediated market
- Information-less trades
- Back Months
- Adjusted Futures Price
- Expected maturity date
- Excess spread
- Quantitative tightening
- Accreted Value
- Equity Clawback
- Soft Dollar Broker
- Stagnation
- Replenishment
- Decoupling
- Holding period
- Regression analysis
- Wealth manager
- Financial plan
- Adequacy of coverage
- Actual market
- Credit risk
- Insurance
- Financial independence
- Annual report
- Financial management
- Ageing schedule
- Global indices
- Folio number
- Accrual basis
- Liquidity risk
- Quick Ratio
- Unearned Income
- Sustainability
- Value at Risk
- Vertical Financial Analysis
- Residual maturity
- Operating Margin
- Trust deed
- Leverage
- Profit and Loss Statement
- Junior Market
- Affinity fraud
- Base currency
- Working capital
- Individual Savings Account
- Redemption yield
- Net profit margin
- Fringe benefits
- Fiscal policy
- Escrow
- Externality
- Multi-level marketing
- Joint tenancy
- Liquidity coverage ratio
- Hurdle rate
- Kiddie tax
- Giffen Goods
- Keynesian economics
- EBITA
- Risk Tolerance
- Disbursement
- Bayes’ Theorem
- Amalgamation
- Adverse selection
- Contribution Margin
- Accounting Equation
- Value chain
- Gross Income
- Net present value
- Liability
- Leverage ratio
- Inventory turnover
- Gross margin
- Collateral
- Being Bearish
- Commodity
- Exchange rate
- Basis point
- Inception date
- Riskometer
- Trigger Option
- Zeta model
- Racketeering
- Market Indexes
- Short Selling
- Quartile rank
- Defeasance
- Cut-off-time
- Business-to-Consumer
- Bankruptcy
- Acquisition
- Turnover Ratio
- Indexation
- Fiduciary responsibility
- Benchmark
- Pegging
- Illiquidity
- Backwardation
- Backup Withholding
- Buyout
- Beneficial owner
- Contingent deferred sales charge
- Exchange privilege
- Asset allocation
- Maturity distribution
- Letter of Intent
- Emerging Markets
- Consensus Estimate
- Cash Settlement
- Cash Flow
- Capital Lease Obligations
- Book-to-Bill-Ratio
- Capital Gains or Losses
- Balance Sheet
- Capital Lease
Most Popular Terms
Other Terms
- Physical ETF
- Initial Public Offering
- Buyback
- Secondary Sharing
- Bookrunner
- Notional amount
- Negative convexity
- Jumbo pools
- Inverse floater
- Forward Swap
- Underwriting risk
- Reinvestment risk
- Final Maturity Date
- Payment Date
- Secondary Market
- Margin Requirement
- Mark-to-market
- Pledged Asset
- Yield Pickup
- Subordinated Debt
- Treasury Stock Method
- Stochastic Oscillator
- Bullet Bonds
- Basket Trade
- Contrarian Strategy
- Notional Value
- Speculation
- Stub
- Trading Volume
- Going Long
- Pink sheet stocks
- Rand cost averaging
- Sustainable investment
- Stop-limit sell order
- Economic Bubble
- Ask Price
- Constant prepayment rate
- Covenants
- Stock symbol
- Companion tranche
- Synthetic replication
- Bourse
- Beneficiary
- Witching Hour
- Widow and Orphan stock
- Public Float
- Closing Price
- Reverse stock splits
- Quiet period
- Prepayment risk
Know More about
Tools/Educational Resources
Markets Offered by POEMS
Read the Latest Market Journal

Back in Business: The Return of IPOs & Top Traded Counters in March 2024
Start trading on POEMS! Open a free account here! At a glance: Major indices continue...

Weekly Updates 15/4/24 – 19/4/24
This weekly update is designed to help you stay informed and relate economic and company...

From $50 to $100: Unveiling the Impact of Inflation
In recent years, inflation has become a hot topic, evoking strong emotions as the cost...

Japan’s Economic Resurgence: Unveiling the Tailwinds Behind Nikkei 225’s Record Leap
Source: eSignal, Intercontinental Exchange, Inc. In the heart of Japan’s economic landscape, the Nikkei 225...

Weekly Updates 8/4/24 – 12/4/24
This weekly update is designed to help you stay informed and relate economic and...

What Makes Forex Trading Attractive?
In a world where the click of a button can send goods across oceans and...

Weekly Updates 1/4/24 – 5/4/24
This weekly update is designed to help you stay informed and relate economic and company...

How to soar higher with Positive Carry!
As US Fed interest rates are predicted to rise 6 times this year, it’s best...


