Leverage ratio
Table of Contents
Leverage ratio
Various financial measures are frequently used to assess a company’s economic success. They cover every facet of the company’s financial situation by concentrating on several criteria. The financial soundness of a corporation is expressed using leverage ratios in terms of the amount of debt it has.
When looking for money, whether a loan from a bank or a venture capitalist, leverage ratios are particularly crucial. Leverage ratios are helpful indications for both banks and businesses of how their assets are financed, whether through debt or equity. Since it’s an evaluation of how readily a firm can satisfy financial obligations, it’s also a helpful indicator for market analysts and investors.
What is leverage ratio?
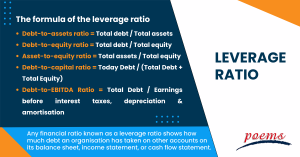
Any financial ratio known as a leverage ratio shows how much debt an organisation has taken on other accounts on its balance sheet, income statement, or cash flow statement. These ratios reveal how the organisation finances its assets and commercial operations (using debt or equity).
Even though debt builds capital, investors view it more as a liability. A corporation employs more debt than equity to develop its resources when its leverage ratio is larger. Additionally, more severe consequences, such as bankruptcy, may result when debt levels are higher.

Understanding leverage ratio
Leverage ratios are a group of ratios that show how financially leveraged a company handles its assets, liabilities, and equity. They reveal how much of an organisation’s capital is derived from debt, which is a reliable indicator of whether a company can honour its financial commitments.
A firm that uses debt to finance its assets and operations will have a higher financial leverage ratio. It is frequently a red flag for potential investors that the company might not be a safe investment. It could imply erratic earnings, and a long wait before shareholders receive a significant return on their investment or even the imminent insolvency of the company.
Creditors also use these criteria to determine whether to extend loans to businesses. If a company’s financial leverage ratio is too high, most of its cash flow is directed towards paying down debt, which increases the risk of loan default. A corporation is often more financially responsible if it has a steady income stream and a lower financial leverage ratio. A high financial leverage ratio indicates to potential investors and credit-rating companies that a company is risk-free and worthwhile, even if the parent company is saddled with huge debt.
The formula of the leverage ratio
The information that investors have access to determines how leverage ratios are calculated. They calculate the percentage and contrast the financial responsibility with the capital a company has built, according to their specifics.
The most commonly used leverage ratios are:
- Debt-to-assets ratio = Total debt / Total assets
- Debt-to-equity ratio = Total debt / Total equity
- Asset-to-equity ratio = Total assets / Total equity
- Debt-to-capital ratio = Today Debt / (Total Debt + Total Equity)
- Debt-to-EBITDA Ratio = Total Debt / Earnings before interest taxes, depreciation & amortisation
Types of leverage ratio
There are two main categories of leverage ratios:
- Capital structure ratio
The capital structure ratio is employed to decide the financing strategy for the business to concentrate on long-term solvency.
The following ratios are included in the capital structure ratio:
- The equity ratio
- The debt ratio
- The debt-to-equity ratio
- Coverage ratios
Coverage ratios assess a company’s capacity to pay dividends and interest on its debt and other debt-related obligations. It is simpler for a company to pay off dividends and interest payments when the coverage ratio is larger.
The coverage ratio includes the following ratios:
- The ratio of debt service to income
- The ratio of interest coverage
- The ratio of capital to debt
Importance of leverage ratio
Leverage ratios provide information on how much debt a company is using. It also assesses the company’s solvency and capital structure. High leverage can be hazardous and advantageous in a corporation’s capital structure.
When a company is making money, using leverage helps to magnify those earnings. On the other hand, a highly leveraged company may struggle if its profitability drops and may run a higher risk of default than an unlevered or less leveraged company in the same circumstances. When a company wants to seek more borrowing, creditors consider the amount of debt it currently has. Leverage increases risk, but if everything works well, it produces a profit.
Frequently Asked Questions
To finance their operations, businesses often use a combination of debt and equity. In many different instances, leverage is created to get this finance. Here are a few examples:
- Acquiring permanent assets, such as real estate, machinery, and equipment, through debt.
- Assuming debt depends on the creditworthiness of the company. Larger businesses are typically the only ones who can get this kind of loan; start-ups rarely do.
- Private equity firms may take on debt to purchase the company.
- One could buy margins, options, or other such securities.
- Borrowing money allows investors to use it as leverage in their holdings.
When a company’s return on assets does not exceed the interest rate of the loan, this results in a considerable reduction in its return on equity and profitability, which is the key danger associated with high financial leverage. As they have a lower proportion of variable expenses and a higher proportion of fixed costs, businesses with stronger operating influence cannot significantly reduce costs during periods of declining sales. As a result, operational profit is less stable, and there is a greater chance of loss.
The capital structure ratio, also known as the long-term debt to capitalization ratio, is computed by dividing the long-term debt by the sum of the long-term debt and shareholders’ equity. It provides important information on a company’s capital position.
The leverage ratio defines how much debt and equity a company uses to fund its operations. It is a vital financial indicator showing how a company finances its operations. It is calculated using the following formula. The debt-to-equity ratio is calculated as Total Debt divided by Shareholder’s Fund.
The ratio of Senior Debt divided by EBITDA for the preceding four fiscal quarters on a rolling basis, less the total amount of all non-tax permitted distributions made by MAALT during such period, is known as the cash flow leverage ratio.
Related Terms
- Trailing Stops
- Exchange Control
- Relevant Cost
- Dow Theory
- Hyperdeflation
- Hope Credit
- Futures contracts
- Human capital
- Subrogation
- Qualifying Annuity
- Strategic Alliance
- Probate Court
- Procurement
- Holding company
- Harmonic mean
- Trailing Stops
- Exchange Control
- Relevant Cost
- Dow Theory
- Hyperdeflation
- Hope Credit
- Futures contracts
- Human capital
- Subrogation
- Qualifying Annuity
- Strategic Alliance
- Probate Court
- Procurement
- Holding company
- Harmonic mean
- Income protection insurance
- Recession
- Savings Ratios
- Pump and dump
- Total Debt Servicing Ratio
- Debt to Asset Ratio
- Liquid Assets to Net Worth Ratio
- Liquidity Ratio
- Personal financial ratios
- T-bills
- Payroll deduction plan
- Operating expenses
- Demand elasticity
- Deferred compensation
- Conflict theory
- Acid-test ratio
- Withholding Tax
- Benchmark index
- Double Taxation Relief
- Debtor Risk
- Securitization
- Yield on Distribution
- Currency Swap
- Overcollateralization
- Efficient Frontier
- Listing Rules
- Green Shoe Options
- Accrued Interest
- Market Order
- Accrued Expenses
- Target Leverage Ratio
- Acceptance Credit
- Balloon Interest
- Abridged Prospectus
- Data Tagging
- Perpetuity
- Hybrid annuity
- Investor fallout
- Intermediated market
- Information-less trades
- Back Months
- Adjusted Futures Price
- Expected maturity date
- Excess spread
- Quantitative tightening
- Accreted Value
- Equity Clawback
- Soft Dollar Broker
- Stagnation
- Replenishment
- Decoupling
- Holding period
- Regression analysis
- Wealth manager
- Financial plan
- Adequacy of coverage
- Actual market
- Credit risk
- Insurance
- Financial independence
- Annual report
- Financial management
- Ageing schedule
- Global indices
- Folio number
- Accrual basis
- Liquidity risk
- Quick Ratio
- Unearned Income
- Sustainability
- Value at Risk
- Vertical Financial Analysis
- Residual maturity
- Operating Margin
- Trust deed
- Leverage
- Profit and Loss Statement
- Junior Market
- Affinity fraud
- Base currency
- Working capital
- Individual Savings Account
- Redemption yield
- Net profit margin
- Fringe benefits
- Fiscal policy
- Escrow
- Externality
- Multi-level marketing
- Joint tenancy
- Liquidity coverage ratio
- Hurdle rate
- Kiddie tax
- Giffen Goods
- Keynesian economics
- EBITA
- Risk Tolerance
- Disbursement
- Bayes’ Theorem
- Amalgamation
- Adverse selection
- Contribution Margin
- Accounting Equation
- Value chain
- Gross Income
- Net present value
- Liability
- Inventory turnover
- Gross margin
- Collateral
- Being Bearish
- Being Bullish
- Commodity
- Exchange rate
- Basis point
- Inception date
- Riskometer
- Trigger Option
- Zeta model
- Racketeering
- Market Indexes
- Short Selling
- Quartile rank
- Defeasance
- Cut-off-time
- Business-to-Consumer
- Bankruptcy
- Acquisition
- Turnover Ratio
- Indexation
- Fiduciary responsibility
- Benchmark
- Pegging
- Illiquidity
- Backwardation
- Backup Withholding
- Buyout
- Beneficial owner
- Contingent deferred sales charge
- Exchange privilege
- Asset allocation
- Maturity distribution
- Letter of Intent
- Emerging Markets
- Consensus Estimate
- Cash Settlement
- Cash Flow
- Capital Lease Obligations
- Book-to-Bill-Ratio
- Capital Gains or Losses
- Balance Sheet
- Capital Lease
Most Popular Terms
Other Terms
- Adjusted distributed income
- International securities exchanges
- Settlement currency
- Federal funds rate
- Active Tranche
- Convertible Securities
- Synthetic ETF
- Physical ETF
- Initial Public Offering
- Buyback
- Secondary Sharing
- Bookrunner
- Notional amount
- Negative convexity
- Jumbo pools
- Inverse floater
- Forward Swap
- Underwriting risk
- Reinvestment risk
- Final Maturity Date
- Payment Date
- Secondary Market
- Margin Requirement
- Mark-to-market
- Pledged Asset
- Yield Pickup
- Subordinated Debt
- Treasury Stock Method
- Stochastic Oscillator
- Bullet Bonds
- Basket Trade
- Contrarian Strategy
- Notional Value
- Speculation
- Stub
- Trading Volume
- Going Long
- Pink sheet stocks
- Rand cost averaging
- Sustainable investment
- Stop-limit sell order
- Economic Bubble
- Ask Price
- Constant prepayment rate
- Covenants
- Stock symbol
- Companion tranche
- Synthetic replication
- Bourse
- Beneficiary
Know More about
Tools/Educational Resources
Markets Offered by POEMS
Read the Latest Market Journal

Navigating the vast world of unit trusts can be daunting. With nearly 2000 funds available...

Predicting Trend Reversals with Candlestick Patterns for Beginners
Candlestick patterns are used to predict the future direction of price movements as they contain...

In the diverse and complex world of investing, unit trusts stand out as a popular...

Back in Business: The Return of IPOs & Top Traded Counters in March 2024
Start trading on POEMS! Open a free account here! At a glance: Major indices continue...

Weekly Updates 15/4/24 – 19/4/24
This weekly update is designed to help you stay informed and relate economic and company...

From $50 to $100: Unveiling the Impact of Inflation
In recent years, inflation has become a hot topic, evoking strong emotions as the cost...

Japan’s Economic Resurgence: Unveiling the Tailwinds Behind Nikkei 225’s Record Leap
Source: eSignal, Intercontinental Exchange, Inc. In the heart of Japan’s economic landscape, the Nikkei 225...

Weekly Updates 8/4/24 – 12/4/24
This weekly update is designed to help you stay informed and relate economic and...


