
Buyout
Table of Contents
Buyout
There are multiple reasons why a company may be bought up. One reason is that the company is underperforming, and the purchaser believes he can turn it around. Another reason is that the company is a valuable asset, and the purchaser wants to take control of it and sell it later.
A buyout can be complex, and several factors must be considered before undertaking a buyout. The most crucial factor is the price. The purchaser must be willing to pay a fair price for the company. The purchaser must also be prepared to finance the buyout and assume the risks associated with the purchase
What is buyout?
A buyout is the purchase of a controlling interest in a company in which the acquirer obtains more than 50% of the company’s voting stock. A buyout can be accomplished through a merger or an acquisition. In a buyout, the purchaser usually obtains a controlling interest in the company, which gives the purchaser the ability to make decisions about the company’s operations.
A buyout can be friendly or hostile. A friendly buyout occurs when the target company’s management supports the acquisition. A hostile buyout occurs when the target company’s management does not support the acquisition. In a hostile buyout, the acquirer may have to pay a premium to obtain the support of the target company’s shareholders.
Types of buyouts
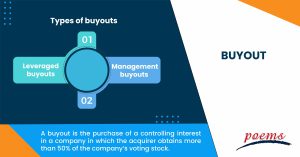
There are two main types of buyouts: leveraged buyouts and management buyouts.
- Leveraged buyouts
In a leveraged buyout, a company is acquired using a combination of debt and equity. The equity is typically provided by a private equity firm, while banks or other financial institutions provide the debt.
- Management buyouts
In a management buyout, a company’s management team buys out the company from its current owners. Management buyouts are typically financed with a combination of equity and debt.
Advantages of buyouts
There are many advantages of buyouts for both the buyer and the seller. For the buyer, a buyout can help to consolidate a particular industry or market and can also help to gain access to new technology or products. For the seller, a buyout can provide a quick and efficient way to exit the business and a tidy sum of cash.
Buyouts offer more efficiency. A buyout may eliminate any aspects of product or service duplication in businesses. It may lower operational costs, which could result in higher earnings.
A company can boost its earnings by buying its rivals. Improved economies of scale and the avoidance of a pricing war with a rival are benefits the buyout may provide the newly formed firm. Customers of the business might benefit from lower prices for the company’s goods or services as a result.
There are also some disadvantages to buyouts, such as the potential for job losses, and the fact that the new owner may not have the same commitment to the business as the previous owner. However, buyouts can be a positive move for both parties involved.
Disadvantages of buyouts
There are several disadvantages of buyouts for the company being bought out and the shareholders.
- First, the company being bought out usually loses its independence and is absorbed into the acquiring company. This can lead to job losses and a loss of control for the company’s shareholders being bought out.
- Second, buyouts can be expensive, and the company’s shareholders may not receive the total value of their shares.
- Finally, buyouts can be disruptive to the company’s business being bought out and lead to losing customers and employees.
What is buyout of a company?
A buyout of a company is when a group of investors purchases a controlling stake in the company. The investors may be private equity firms, venture capitalists, or hedge funds.
A buyout usually takes the company private, so it can be restructured without the scrutiny of the markets. Sometimes a buyout can also be a hostile takeover, where the investors attempt to replace the company’s management.
There are several steps involved in a company buyout.
- The first step is to find a buyer interested in purchasing the company.
- The next step is to negotiate a purchase price and terms of the sale.
- Once the buyer and seller have agreed on a price, the next step is obtaining the sale’s financing. The buyer will then need to complete due diligence on the company to ensure it is a sound investment.
- Once the buyer has satisfied all their due diligence requirements, the final step is to close on the sale and transfer ownership of the company to the buyer.
Frequently Asked Questions
When a public firm’s shares are purchased to convert it to a private corporation, this is known as a “buyout private equity” scenario.
A leveraged buyout (LBO) is a type of financial transaction in which a company is acquired using borrowed money. The borrowing is typically done through the use of high-yield bonds, which are also known as junk bonds. The borrowed money is used to pay for the acquisition, and the resulting company is typically highly leveraged, with a large amount of debt relative to its equity.
There are a few critical differences between buyouts and acquisitions. In a buyout, the target company is completely acquired and taken over by the buyer. This means that the target company ceases to exist as a separate entity. On the other hand, in an acquisition, the target company is not entirely acquired – the buyer takes over a majority stake in the company.
The company buyout process begins when a prospective acquirer submits a formalised buyout offer to a target firm’s management. The target company’s management and the potential purchaser then engage in several talks. The management shares its views with the shareholders.
A portfolio buyout is an investment strategy in which an investor acquires a portfolio of assets, usually intending to hold onto those assets for an extended period. The buyout can be structured in several ways, but typically, the investor will purchase the assets from the current owner or owners using a mix of debt and equity.
Related Terms
- Cost of Equity
- Capital Adequacy Ratio (CAR)
- Interest Coverage Ratio
- Industry Groups
- Income Statement
- Historical Volatility (HV)
- Embedded Options
- Dynamic Asset Allocation
- Depositary Receipts
- Deferment Payment Option
- Debt-to-Equity Ratio
- Financial Futures
- Contingent Capital
- Conduit Issuers
- Calendar Spread
- Devaluation
- Grading Certificates
- Distributable Net Income
- Cover Order
- Tracking Index
- Auction Rate Securities
- Arbitrage-Free Pricing
- Net Profits Interest
- Borrowing Limit
- Algorithmic Trading
- Corporate Action
- Spillover Effect
- Economic Forecasting
- Treynor Ratio
- Hammer Candlestick
- DuPont Analysis
- Net Profit Margin
- Law of One Price
- Annual Value
- Rollover option
- Financial Analysis
- Currency Hedging
- Lump sum payment
- Annual Percentage Yield (APY)
- Excess Equity
- Fiduciary Duty
- Bought-deal underwriting
- Anonymous Trading
- Fair Market Value
- Fixed Income Securities
- Redemption fee
- Acid Test Ratio
- Bid Ask price
- Finance Charge
- Futures
- Basis grades
- Short Covering
- Visible Supply
- Transferable notice
- Intangibles expenses
- Strong order book
- Fiat money
- Trailing Stops
- Exchange Control
- Relevant Cost
- Dow Theory
- Hyperdeflation
- Hope Credit
- Futures contracts
- Human capital
- Subrogation
- Qualifying Annuity
- Strategic Alliance
- Probate Court
- Procurement
- Holding company
- Harmonic mean
- Income protection insurance
- Recession
- Savings Ratios
- Pump and dump
- Total Debt Servicing Ratio
- Debt to Asset Ratio
- Liquid Assets to Net Worth Ratio
- Liquidity Ratio
- Personal financial ratios
- Payroll deduction plan
- Operating expenses
- Demand elasticity
- Deferred compensation
- Conflict theory
- Acid-test ratio
- Withholding Tax
- Benchmark index
- Double Taxation Relief
- Debtor Risk
- Securitization
- Yield on Distribution
- Currency Swap
- Overcollateralization
- Efficient Frontier
- Listing Rules
- Green Shoe Options
- Accrued Interest
- Market Order
- Accrued Expenses
- Target Leverage Ratio
- Acceptance Credit
- Balloon Interest
- Abridged Prospectus
- Data Tagging
- Perpetuity
- Optimal portfolio
- Hybrid annuity
- Investor fallout
- Intermediated market
- Information-less trades
- Back Months
- Adjusted Futures Price
- Expected maturity date
- Excess spread
- Quantitative tightening
- Accreted Value
- Equity Clawback
- Soft Dollar Broker
- Stagnation
- Replenishment
- Decoupling
- Holding period
- Regression analysis
- Wealth manager
- Financial plan
- Adequacy of coverage
- Actual market
- Credit risk
- Insurance
- Financial independence
- Annual report
- Financial management
- Ageing schedule
- Global indices
- Folio number
- Accrual basis
- Liquidity risk
- Quick Ratio
- Unearned Income
- Sustainability
- Value at Risk
- Vertical Financial Analysis
- Residual maturity
- Operating Margin
- Trust deed
- Profit and Loss Statement
- Junior Market
- Affinity fraud
- Base currency
- Working capital
- Individual Savings Account
- Redemption yield
- Net profit margin
- Fringe benefits
- Fiscal policy
- Escrow
- Externality
- Multi-level marketing
- Joint tenancy
- Liquidity coverage ratio
- Hurdle rate
- Kiddie tax
- Giffen Goods
- Keynesian economics
- EBITA
- Risk Tolerance
- Disbursement
- Bayes’ Theorem
- Amalgamation
- Adverse selection
- Contribution Margin
- Accounting Equation
- Value chain
- Gross Income
- Net present value
- Liability
- Leverage ratio
- Inventory turnover
- Gross margin
- Collateral
- Being Bearish
- Being Bullish
- Commodity
- Exchange rate
- Basis point
- Inception date
- Riskometer
- Trigger Option
- Zeta model
- Racketeering
- Market Indexes
- Short Selling
- Quartile rank
- Defeasance
- Cut-off-time
- Business-to-Consumer
- Bankruptcy
- Acquisition
- Turnover Ratio
- Indexation
- Fiduciary responsibility
- Benchmark
- Pegging
- Illiquidity
- Backwardation
- Backup Withholding
- Beneficial owner
- Contingent deferred sales charge
- Exchange privilege
- Asset allocation
- Maturity distribution
- Letter of Intent
- Emerging Markets
- Consensus Estimate
- Cash Settlement
- Cash Flow
- Capital Lease Obligations
- Book-to-Bill-Ratio
- Capital Gains or Losses
- Balance Sheet
- Capital Lease
Most Popular Terms
Other Terms
- Bond Convexity
- Compound Yield
- Brokerage Account
- Discretionary Accounts
- Industry Groups
- Growth Rate
- Green Bond Principles
- Gamma Scalping
- Funding Ratio
- Free-Float Methodology
- Foreign Direct Investment (FDI)
- Floating Dividend Rate
- Flight to Quality
- Real Return
- Protective Put
- Perpetual Bond
- Option Adjusted Spread (OAS)
- Non-Diversifiable Risk
- Merger Arbitrage
- Liability-Driven Investment (LDI)
- Income Bonds
- Guaranteed Investment Contract (GIC)
- Flash Crash
- Equity Carve-Outs
- Cost Basis
- Deferred Annuity
- Cash-on-Cash Return
- Earning Surprise
- Bubble
- Beta Risk
- Bear Spread
- Asset Play
- Accrued Market Discount
- Ladder Strategy
- Junk Status
- Intrinsic Value of Stock
- Interest-Only Bonds (IO)
- Inflation Hedge
- Incremental Yield
- Industrial Bonds
- Holding Period Return
- Hedge Effectiveness
- Flat Yield Curve
- Fallen Angel
- Exotic Options
- Execution Risk
- Exchange-Traded Notes
- Event-Driven Strategy
- Eurodollar Bonds
- Enhanced Index Fund
Know More about
Tools/Educational Resources
Markets Offered by POEMS
Read the Latest Market Journal

Semiconductor Sector Sustains Strong Growth Momentum with Accelerating Revenue Expansion
Sector Performance Driven by Memory Boom and AI Infrastructure Demand The semiconductor sector continues to demonstrate robust growth momentum, with the Semiconductor ETF surging 39.9% over the past three months, significantly outperforming the S&P 500's 11.4% gain. Memory companies have emerged as the standout performers, posting exceptional gains of 95% driven by extraordinary first-quarter 2026 earnings growth exceeding 900% year-on-year. This remarkable performance stems from a substantial surge in DRAM and NAND prices amid widespread memory chip shortages. Extended Supply Contracts Signal Long-Term Industry Stability A notable shift in industry dynamics has emerged through the establishment of longer-term supply agreements. Hyperscalers and high-end chipmakers are now committing to multi-year contracts extending until 2030, representing a significant departure from previous agreements that typically lasted only one year with flexible financing terms. These new arrangements require approximately 20% cash deposits to secure supply, demonstrating the critical importance of memory chips in AI data centre buildouts. Equipment manufacturers report that these extended memory contracts provide enhanced supply chain visibility extending through the end of 2027. Processor Segment Shows Accelerating Growth Trajectory The processor segment continues its growth acceleration, with first-quarter 2026 revenue surging 53% year-on-year, up from 40% growth in the fourth quarter of 2025. This momentum is expected to continue, with second-quarter 2026 revenue guidance indicating a substantial 67% year-on-year increase to US$159 billion. The growth is underpinned by robust hyperscaler demand for data centre GPUs, CPUs, and ASICs. NVIDIA leads the sector with first-quarter revenue spiking 85% year-on-year to US$81.6 billion, marking the third consecutive quarter of accelerating growth. AMD demonstrated its strongest year-on-year growth since 2022, with revenue increasing 38% to US$10.3 billion, driven by MI350 GPU and fifth-generation EPYC CPU adoption. Broadcom achieved its strongest growth since 2016, with revenue rising 48% year-on-year to US$22.2 billion, supported by AI semiconductor revenue that grew 143% year-on-year to a record US$10.8 billion. The sector maintains strong forward momentum, supported by hyperscalers' combined 2026 capital expenditure guidance of US$710 billion, representing an 89% year-on-year increase. Equipment players continue to benefit from strong services demand as memory customers seek performance upgrades on existing tools due to limited cleanroom space. Frequently Asked Questions [market_journal_faq] This article has been auto-generated using PhillipGPT. It is based on a report by a Phillip Securities Research analyst. Disclaimer These commentaries are intended for general circulation and do not have regard to the specific investment objectives, financial situation and particular needs of any person. Accordingly, no warranty whatsoever is given and no liability whatsoever is accepted for any loss arising whether directly or indirectly as a result of any person acting based on this information. You should seek advice from a financial adviser regarding the suitability of any investment product(s) mentioned herein, taking into account your specific investment objectives, financial situation or particular needs, before making a commitment to invest in such products. Opinions expressed in these commentaries are subject to change without notice. Investments are subject to investment risks including the possible loss of the principal amount invested. The value of units in any fund and the income from them may fall as well as rise. Past performance figures as well as any projection or forecast used in these commentaries are not necessarily indicative of future or likely performance. Phillip Securities Pte Ltd (PSPL), its directors, connected persons or employees may from time to time have an interest in the financial instruments mentioned in these commentaries. The information contained in these commentaries has been obtained from public sources which PSPL has no reason to believe are unreliable and any analysis, forecasts, projections, expectations and opinions (collectively the “Research”) contained in these commentaries are based on such information and are expressions of belief only. PSPL has not verified this information and no representation or warranty, express or implied, is made that such information or Research is accurate, complete or verified or should be relied upon as such. Any such information or Research contained in these commentaries are subject to change, and PSPL shall not have any responsibility to maintain the information or Research made available or to supply any corrections, updates or releases in connection therewith. In no event will PSPL be liable for any special, indirect, incidental or consequential damages which may be incurred from the use of the information or Research made available, even if it has been advised of the possibility of such damages. The companies and their employees mentioned in these commentaries cannot be held liable for any errors, inaccuracies and/or omissions howsoever caused. Any opinion or advice herein is made on a general basis and is subject to change without notice. The information provided in these commentaries may contain optimistic statements regarding future events or future financial performance of countries, markets or companies. You must make your own financial assessment of the relevance, accuracy and adequacy of the information provided in these commentaries. Views and any strategies described in these commentaries may not be suitable for all investors. Opinions expressed herein may differ from the opinions expressed by other units of PSPL or its connected persons and associates. Any reference to or discussion of investment products or commodities in these commentaries is purely for illustrative purposes only and must not be construed as a recommendation, an offer or solicitation for the subscription, purchase or sale of the investment products or commodities mentioned. This advertisement has not been reviewed by the Monetary Authority of Singapore.

Singapore Airlines Benefits from Fuel Hedging Amid Jet Fuel Volatility, Maintains Market Position
Aviation Sector Performance and Fuel Dynamics Singapore's aviation sector delivered steady performance in June 2026, with SATS leading gains at 14.2%, followed by Singapore Airlines at 11.6% and SIA Engineering at 7.3%. Meanwhile, CAO declined 1.1%. The sector continues to navigate volatile jet fuel markets, with Singapore jet fuel prices currently trading at US$115 per barrel, down significantly from the March 2026 peak of US$240.5 per barrel following a US-Iran peace deal that reduced prices by approximately 50%. Singapore Airlines' Strategic Positioning Singapore Airlines has demonstrated resilience through its comprehensive hedging strategy and operational adaptability. The carrier maintains a dual hedge structure covering both Brent crude and jet fuel, with 35% hedging on jet fuel and 14% on Brent crude for the second quarter of FY2026/27. This positioning has provided relative insulation from fuel price volatility compared to unhedged competitors. The airline has capitalised on several market opportunities, including rerouted demand for Asia-Europe flights stopping over in Singapore due to regional conflicts. Additionally, Singapore Airlines benefits from rising cargo yields, with global freight rates increasing 41% year-on-year to US$3.40 per kilogram. The company's budget subsidiary, Scoot, has captured demand from regional low-cost carriers that grounded aircraft during the conflict period. Market Outlook and Competitive Landscape Despite current price reductions, jet fuel remains approximately 33% above the 2025 averages of US$90 per barrel. Regional carriers show varying degrees of hedging protection, with Singapore Airlines, Cathay Pacific, Japan Airlines, and ANA maintaining stronger hedged positions. Conversely, China's Big Three airlines—Air China, China Southern, and China Eastern—remain largely unhedged and face greater exposure to fuel price fluctuations. The cargo segment presents additional opportunities, as the partial grounding of Middle East airlines has removed significant capacity from India-Europe and China/Southeast Asia-Europe routes. This capacity reduction has pushed Asia-Europe spot rates to US$5.26 per kilogram in late June, representing a 38% year-on-year increase. While Singapore Airlines' cargo revenue exposure of 11% makes it a secondary beneficiary compared to carriers with higher cargo proportions, the company still stands to benefit from elevated rates. Analysts maintain a neutral stance on air transportation, given uncertain resolution of geopolitical conflicts and the potential for renewed fuel price volatility if ceasefires break down. Frequently Asked Questions [market_journal_faq] This article has been auto-generated using PhillipGPT. It is based on a report by a Phillip Securities Research analyst. Disclaimer These commentaries are intended for general circulation and do not have regard to the specific investment objectives, financial situation and particular needs of any person. Accordingly, no warranty whatsoever is given and no liability whatsoever is accepted for any loss arising whether directly or indirectly as a result of any person acting based on this information. You should seek advice from a financial adviser regarding the suitability of any investment product(s) mentioned herein, taking into account your specific investment objectives, financial situation or particular needs, before making a commitment to invest in such products. Opinions expressed in these commentaries are subject to change without notice. Investments are subject to investment risks including the possible loss of the principal amount invested. The value of units in any fund and the income from them may fall as well as rise. Past performance figures as well as any projection or forecast used in these commentaries are not necessarily indicative of future or likely performance. Phillip Securities Pte Ltd (PSPL), its directors, connected persons or employees may from time to time have an interest in the financial instruments mentioned in these commentaries. The information contained in these commentaries has been obtained from public sources which PSPL has no reason to believe are unreliable and any analysis, forecasts, projections, expectations and opinions (collectively the “Research”) contained in these commentaries are based on such information and are expressions of belief only. PSPL has not verified this information and no representation or warranty, express or implied, is made that such information or Research is accurate, complete or verified or should be relied upon as such. Any such information or Research contained in these commentaries are subject to change, and PSPL shall not have any responsibility to maintain the information or Research made available or to supply any corrections, updates or releases in connection therewith. In no event will PSPL be liable for any special, indirect, incidental or consequential damages which may be incurred from the use of the information or Research made available, even if it has been advised of the possibility of such damages. The companies and their employees mentioned in these commentaries cannot be held liable for any errors, inaccuracies and/or omissions howsoever caused. Any opinion or advice herein is made on a general basis and is subject to change without notice. The information provided in these commentaries may contain optimistic statements regarding future events or future financial performance of countries, markets or companies. You must make your own financial assessment of the relevance, accuracy and adequacy of the information provided in these commentaries. Views and any strategies described in these commentaries may not be suitable for all investors. Opinions expressed herein may differ from the opinions expressed by other units of PSPL or its connected persons and associates. Any reference to or discussion of investment products or commodities in these commentaries is purely for illustrative purposes only and must not be construed as a recommendation, an offer or solicitation for the subscription, purchase or sale of the investment products or commodities mentioned. This advertisement has not been reviewed by the Monetary Authority of Singapore.

Gold in 2026: Why Analysts Believe the Rally May Continue
Gold has emerged as one of the strongest-performing major asset classes, attracting investors seeking portfolio diversification and protection against economic uncertainty. After delivering exceptional returns in 2025, many market analysts continue to see upside potential for gold in 2026. Gold at a Glance Metric Value Spot Gold Price (11 June 2026) US$4,073/oz 2026 Peak Price US$5,595/oz J.P. Morgan Bull Case Target US$6,300/oz 2025 Return +60% These figures illustrate why gold remains one of the most discussed asset classes among investors. Ways to Invest in Gold Investors can gain exposure to gold through several investment vehicles, each offering different benefits and risks. Investment Type Suitable For Key Benefits Physical Gold Long-term holders Direct ownership Gold ETFs Most retail investors Low cost, easy trading Mining Stocks Growth investors Potentially higher returns Futures & CFDs Experienced traders Leveraged exposure Why Many Investors Prefer Gold ETFs Gold ETFs have become one of the easiest ways to invest in gold because they offer exposure to the price of gold without the need to buy, store, or insure physical bullion. The infographic compares US-listed Gold ETFs and highlights their management fees and fund sizes. The Investment Case for Gold Gold has historically been viewed as both a defensive asset and a portfolio diversifier. During periods of inflation, geopolitical uncertainty, or financial market volatility, investors often increase their allocations to gold. Why Investors Consider Gold Acts as a hedge against inflation Diversifies investment portfolios Preserves purchasing power over time Can perform well during market uncertainty Offers high global liquidity Should You Buy Physical Gold or Gold ETFs? For most retail investors, Gold ETFs offer several advantages: Feature Physical Gold Gold ETF Storage Required Yes No Easy to Trade Limited Yes Brokerage Account No Yes Liquidity Moderate High Ongoing Costs Storage & Insurance Management Fee Frequently Asked Questions [market_journal_faq] Disclaimer These commentaries are intended for general circulation and do not have regard to the specific investment objectives, financial situation and particular needs of any person. Accordingly, no warranty whatsoever is given and no liability whatsoever is accepted for any loss arising whether directly or indirectly as a result of any person acting based on this information. You should seek advice from a financial adviser regarding the suitability of any investment product(s) mentioned herein, taking into account your specific investment objectives, financial situation or particular needs, before making a commitment to invest in such products. Opinions expressed in these commentaries are subject to change without notice. Investments are subject to investment risks including the possible loss of the principal amount invested. The value of units in any fund and the income from them may fall as well as rise. Past performance figures as well as any projection or forecast used in these commentaries are not necessarily indicative of future or likely performance. Phillip Securities Pte Ltd (PSPL), its directors, connected persons or employees may from time to time have an interest in the financial instruments mentioned in these commentaries. The information contained in these commentaries has been obtained from public sources which PSPL has no reason to believe are unreliable and any analysis, forecasts, projections, expectations and opinions (collectively the “Research”) contained in these commentaries are based on such information and are expressions of belief only. PSPL has not verified this information and no representation or warranty, express or implied, is made that such information or Research is accurate, complete or verified or should be relied upon as such. Any such information or Research contained in these commentaries are subject to change, and PSPL shall not have any responsibility to maintain the information or Research made available or to supply any corrections, updates or releases in connection therewith. In no event will PSPL be liable for any special, indirect, incidental or consequential damages which may be incurred from the use of the information or Research made available, even if it has been advised of the possibility of such damages. The companies and their employees mentioned in these commentaries cannot be held liable for any errors, inaccuracies and/or omissions howsoever caused. Any opinion or advice herein is made on a general basis and is subject to change without notice. The information provided in these commentaries may contain optimistic statements regarding future events or future financial performance of countries, markets or companies. You must make your own financial assessment of the relevance, accuracy and adequacy of the information provided in these commentaries. Views and any strategies described in these commentaries may not be suitable for all investors. Opinions expressed herein may differ from the opinions expressed by other units of PSPL or its connected persons and associates. Any reference to or discussion of investment products or commodities in these commentaries is purely for illustrative purposes only and must not be construed as a recommendation, an offer or solicitation for the subscription, purchase or sale of the investment products or commodities mentioned. This advertisement has not been reviewed by the Monetary Authority of Singapore.

Singapore Equities Show Strong Momentum as AI Cycle Drives Growth, Banks and Semiconductors Favoured
Market Performance and Outlook Singapore equities have demonstrated robust performance, posting their fourth consecutive quarter of gains with a 5.8% rise in 2Q26. The market reached record highs on 25th June and was up 11.3% for the first half of 2026. The ceasefire in the Middle East has particularly benefited transportation stocks, whilst increased volatility supported exchanges and banking shares. Expectations of bottoming interest rates have further rallied banking stocks, though energy-related equities have faced pressure from sluggish oil and gas capital expenditure and falling energy prices. AI Investment Cycle: Booming Not Bubbling Phillip Securities Research maintains that current market conditions do not constitute an AI bubble. The firm identifies several key factors supporting this view. Massive AI and data centre capital expenditure by hyperscalers, including Oracle and Meta, is expected to rise 73% in 2026 and 22% in 2027, cascading into substantial semiconductor purchases with billings rising 86% year-to-date to reach an annualised US$1 trillion . Wafer fabrication capital expenditure is projected to jump 40% year-on-year to US$175 billion. The driving force behind this spending stems from frontier AI models, particularly Anthropic and OpenAI, whose combined revenue could total US$85 billion this year. Under an S-curve growth trajectory, revenue is expected to reach US$300 billion by 2030, justifying the capital expenditure spike. Current technology sector valuations remain significantly below dot-com bubble levels, with Nvidia trading at 24 times price-to-earnings compared to Cisco's peak of 150 times forward price-to-earnings in 2000. Investment Strategy and Sector Preferences The research house favours banks, semiconductors, building materials, power, and higher-yielding REITs. Banking stocks benefit from resilient dividend yields of around 4% and loan growth surging towards 8% year-on-year, a four-year high. A major spike in deposits following the Middle East conflict, with March recording a S$66 billion jump compared to the prior five-year monthly average of S$9 billion , should help lower funding costs. Semiconductor stocks are expected to register the fastest growth, fuelled by record demand from key equipment customers including ASML, Applied Materials, and Lam Research. In construction, whilst order momentum has slowed, activity has increased, supporting a 29% rise in ready-mixed concrete demand. Frequently Asked Questions [market_journal_faq] This article has been auto-generated using PhillipGPT. It is based on a report by a Phillip Securities Research analyst. Disclaimer These commentaries are intended for general circulation and do not have regard to the specific investment objectives, financial situation and particular needs of any person. Accordingly, no warranty whatsoever is given and no liability whatsoever is accepted for any loss arising whether directly or indirectly as a result of any person acting based on this information. You should seek advice from a financial adviser regarding the suitability of any investment product(s) mentioned herein, taking into account your specific investment objectives, financial situation or particular needs, before making a commitment to invest in such products. Opinions expressed in these commentaries are subject to change without notice. Investments are subject to investment risks including the possible loss of the principal amount invested. The value of units in any fund and the income from them may fall as well as rise. Past performance figures as well as any projection or forecast used in these commentaries are not necessarily indicative of future or likely performance. Phillip Securities Pte Ltd (PSPL), its directors, connected persons or employees may from time to time have an interest in the financial instruments mentioned in these commentaries. The information contained in these commentaries has been obtained from public sources which PSPL has no reason to believe are unreliable and any analysis, forecasts, projections, expectations and opinions (collectively the “Research”) contained in these commentaries are based on such information and are expressions of belief only. PSPL has not verified this information and no representation or warranty, express or implied, is made that such information or Research is accurate, complete or verified or should be relied upon as such. Any such information or Research contained in these commentaries are subject to change, and PSPL shall not have any responsibility to maintain the information or Research made available or to supply any corrections, updates or releases in connection therewith. In no event will PSPL be liable for any special, indirect, incidental or consequential damages which may be incurred from the use of the information or Research made available, even if it has been advised of the possibility of such damages. The companies and their employees mentioned in these commentaries cannot be held liable for any errors, inaccuracies and/or omissions howsoever caused. Any opinion or advice herein is made on a general basis and is subject to change without notice. The information provided in these commentaries may contain optimistic statements regarding future events or future financial performance of countries, markets or companies. You must make your own financial assessment of the relevance, accuracy and adequacy of the information provided in these commentaries. Views and any strategies described in these commentaries may not be suitable for all investors. Opinions expressed herein may differ from the opinions expressed by other units of PSPL or its connected persons and associates. Any reference to or discussion of investment products or commodities in these commentaries is purely for illustrative purposes only and must not be construed as a recommendation, an offer or solicitation for the subscription, purchase or sale of the investment products or commodities mentioned. This advertisement has not been reviewed by the Monetary Authority of Singapore.

ETF Monthly Outlook: Sideways Consolidation Expected Across Most Asset Classes in July 2026
Market Overview and Performance Summary The ETF market landscape presents a mixed picture heading into July 2026, with most major asset classes expected to enter periods of sideways consolidation following varied performance in June. According to the latest monthly analysis, investors should prepare for range-bound trading across several key exchange-traded funds tracking major indices and commodities. Asset Class Performance Analysis Equities showed divergent trends during June, with the Vanguard S&P 500 ETF (VOO) ending two consecutive months of gains with a 0.9% decline. The fund is expected to extend its sideways consolidation from June into July as markets digest recent moves. In contrast, Singapore equities demonstrated strength, with the SPDR Singapore Equities ETF (ES3) posting its third consecutive monthly gain of 3% in June, though analysts expect consolidation after the ETF reached target levels. Fixed income markets remained relatively stable, with the iShares 7-10 Year Treasury Bond ETF (IEF) trading flat during June. The bond ETF is anticipated to remain range-bound between US$93.40 and US$95.40 in July, extending a sideways consolidation pattern that has persisted since mid-March. Commodities faced significant headwinds, particularly in the precious metals sector. The SPDR Gold MiniShares Trust (GLDM) recorded its fourth consecutive monthly decline, tumbling 11.6% in June. Despite this weakness, analysts expect sideways consolidation in July, with support likely to hold at US$77.50 should the price retest the swing low from October 2025. Energy sector weakness continued, with the SPDR S&P Oil & Gas Exploration & Production ETF (XOP) falling 5.4% in June, marking its third consecutive monthly decline. The ETF is expected to consolidate sideways in July, with support anticipated in the US$148 to US$154 area. Notable Underperformers The cryptocurrency space showed particular vulnerability, with the ProShares Bitcoin Strategy ETF (BITO) tumbling 20.2% in June, marking its second consecutive monthly decline. Unlike other asset classes, Bitcoin ETFs are expected to continue their bearish trend in July, potentially retesting the US$7.44 swing low from August 2024, representing a 6.7% downside from current levels. Asian markets also faced pressure, with the Hang Seng China Enterprises Index ETF (2828) declining 9.6% in June for its second consecutive monthly drop. However, sideways consolidation is expected, with support between HKD$74.65 and HKD$77.10. Frequently Asked Questions [market_journal_faq] This article has been auto-generated using PhillipGPT. It is based on a report by a Phillip Securities Research analyst. Disclaimer These commentaries are intended for general circulation and do not have regard to the specific investment objectives, financial situation and particular needs of any person. Accordingly, no warranty whatsoever is given and no liability whatsoever is accepted for any loss arising whether directly or indirectly as a result of any person acting based on this information. You should seek advice from a financial adviser regarding the suitability of any investment product(s) mentioned herein, taking into account your specific investment objectives, financial situation or particular needs, before making a commitment to invest in such products. Opinions expressed in these commentaries are subject to change without notice. Investments are subject to investment risks including the possible loss of the principal amount invested. The value of units in any fund and the income from them may fall as well as rise. Past performance figures as well as any projection or forecast used in these commentaries are not necessarily indicative of future or likely performance. Phillip Securities Pte Ltd (PSPL), its directors, connected persons or employees may from time to time have an interest in the financial instruments mentioned in these commentaries. The information contained in these commentaries has been obtained from public sources which PSPL has no reason to believe are unreliable and any analysis, forecasts, projections, expectations and opinions (collectively the “Research”) contained in these commentaries are based on such information and are expressions of belief only. PSPL has not verified this information and no representation or warranty, express or implied, is made that such information or Research is accurate, complete or verified or should be relied upon as such. Any such information or Research contained in these commentaries are subject to change, and PSPL shall not have any responsibility to maintain the information or Research made available or to supply any corrections, updates or releases in connection therewith. In no event will PSPL be liable for any special, indirect, incidental or consequential damages which may be incurred from the use of the information or Research made available, even if it has been advised of the possibility of such damages. The companies and their employees mentioned in these commentaries cannot be held liable for any errors, inaccuracies and/or omissions howsoever caused. Any opinion or advice herein is made on a general basis and is subject to change without notice. The information provided in these commentaries may contain optimistic statements regarding future events or future financial performance of countries, markets or companies. You must make your own financial assessment of the relevance, accuracy and adequacy of the information provided in these commentaries. Views and any strategies described in these commentaries may not be suitable for all investors. Opinions expressed herein may differ from the opinions expressed by other units of PSPL or its connected persons and associates. Any reference to or discussion of investment products or commodities in these commentaries is purely for illustrative purposes only and must not be construed as a recommendation, an offer or solicitation for the subscription, purchase or sale of the investment products or commodities mentioned. This advertisement has not been reviewed by the Monetary Authority of Singapore.

Software Sector Remains Resilient Amid AI Disruption Concerns
Market Performance and Sector Dynamics The software sector experienced notable volatility in the first quarter of 2026, with the iShares Expanded Tech-Software Sector ETF (IGV) declining 20% year-to-date despite a 4% quarter-on-quarter recovery. This performance significantly lagged the S&P 500's 8% gain, reflecting investor concerns about higher capital expenditure guidance and a rotation towards AI infrastructure plays. Within the ETF, performance diverged sharply across different software categories. Cybersecurity leaders Palo Alto Networks (PANW) and CrowdStrike (CRWD) outperformed, alongside data analytics companies MongoDB (MDB) and Snowflake (SNOW). However, traditional software-as-a-service (SaaS) companies faced significant pressure, with Palantir declining 40%, Adobe falling 44%, and Salesforce dropping 43% amid SaaS derating and concerns about agentic AI disruption. Fundamental Strength Persists Despite market pessimism surrounding potential AI disruption, the underlying fundamentals of the software sector remain robust. SaaS companies delivered their strongest revenue performance in 14 quarters, with last-12-months revenue growth accelerating to 17% year-on-year in the first quarter of 2026, representing a 4.4 percentage point improvement from the previous year. Large-cap SaaS companies demonstrated particular resilience, maintaining 17% year-on-year growth while preserving superior profitability metrics. This performance suggests that market leaders have experienced limited disruption from AI technologies, contrary to broader market concerns about sector-wide displacement. Investment Strategy and Outlook Phillip Securities Research maintains an OVERWEIGHT rating on the software sector, focusing on three key areas positioned to benefit from AI adoption: SaaS infrastructure, cybersecurity, and data analytics. Top stock picks include Microsoft, Oracle, Palantir, and Palo Alto Networks, supported by strong AI and cloud adoption trends, robust demand visibility, and growing cybersecurity requirements. The current valuation environment presents opportunities, with large-cap SaaS companies trading at EV/Sales ratios of 9.5 times, representing the negative one standard deviation level despite rising software revenue and net income. The strategy emphasizes companies that provide essential AI infrastructure, maintain mission-critical cybersecurity functions, and offer data analytics capabilities crucial for enterprise AI implementation. Frequently Asked Questions [market_journal_faq] This article has been auto-generated using PhillipGPT. It is based on a report by a Phillip Securities Research analyst. Disclaimer These commentaries are intended for general circulation and do not have regard to the specific investment objectives, financial situation and particular needs of any person. Accordingly, no warranty whatsoever is given and no liability whatsoever is accepted for any loss arising whether directly or indirectly as a result of any person acting based on this information. You should seek advice from a financial adviser regarding the suitability of any investment product(s) mentioned herein, taking into account your specific investment objectives, financial situation or particular needs, before making a commitment to invest in such products. Opinions expressed in these commentaries are subject to change without notice. Investments are subject to investment risks including the possible loss of the principal amount invested. The value of units in any fund and the income from them may fall as well as rise. Past performance figures as well as any projection or forecast used in these commentaries are not necessarily indicative of future or likely performance. Phillip Securities Pte Ltd (PSPL), its directors, connected persons or employees may from time to time have an interest in the financial instruments mentioned in these commentaries. The information contained in these commentaries has been obtained from public sources which PSPL has no reason to believe are unreliable and any analysis, forecasts, projections, expectations and opinions (collectively the “Research”) contained in these commentaries are based on such information and are expressions of belief only. PSPL has not verified this information and no representation or warranty, express or implied, is made that such information or Research is accurate, complete or verified or should be relied upon as such. Any such information or Research contained in these commentaries are subject to change, and PSPL shall not have any responsibility to maintain the information or Research made available or to supply any corrections, updates or releases in connection therewith. In no event will PSPL be liable for any special, indirect, incidental or consequential damages which may be incurred from the use of the information or Research made available, even if it has been advised of the possibility of such damages. The companies and their employees mentioned in these commentaries cannot be held liable for any errors, inaccuracies and/or omissions howsoever caused. Any opinion or advice herein is made on a general basis and is subject to change without notice. The information provided in these commentaries may contain optimistic statements regarding future events or future financial performance of countries, markets or companies. You must make your own financial assessment of the relevance, accuracy and adequacy of the information provided in these commentaries. Views and any strategies described in these commentaries may not be suitable for all investors. Opinions expressed herein may differ from the opinions expressed by other units of PSPL or its connected persons and associates. Any reference to or discussion of investment products or commodities in these commentaries is purely for illustrative purposes only and must not be construed as a recommendation, an offer or solicitation for the subscription, purchase or sale of the investment products or commodities mentioned. This advertisement has not been reviewed by the Monetary Authority of Singapore.
UltraGreen.ai Positioned for Growth with ICG Platform Expansion, BUY Rating and US$1.92 Target Price
Phillip Securities Research has initiated coverage on UltraGreen.ai with a BUY rating and target price of US$1.92, highlighting the company's transformation from a traditional dye and hardware business into an integrated indocyanine green (ICG) platform. The research firm's valuation is based on DCF analysis, utilising a 10% WACC and 7 times exit multiple. The company is currently trading at FY26e forward P/E of 15.2 times and EV/EBITDA of 16 times. Company Overview UltraGreen.ai operates in the fluorescence-guided surgery market, providing ICG dyes and near-infrared imaging hardware to healthcare providers. The company is expanding its business model beyond commodity products to become a comprehensive ICG platform provider, incorporating data analytics and software solutions. Market Opportunity and Penetration Drivers Strong market tailwinds are driving greater ICG penetration across both established and emerging surgical procedures globally. Currently, ICG penetration across surgical procedures remains in the low double-digits, with the exception of choroid diagnostics. However, penetration rates are expected to increase by double digits across the majority of procedures using fluorescence-guided surgery by 2028. The primary driver for this expansion is the growing adoption of ICG as a standard of care, with major surgical societies incorporating ICG into their clinical guidelines. A significant catalyst for UltraGreen.ai will be the expiry of Novadaq's Breast Sentinel Lymph Node exclusivity in June 2026, enabling the company to file for US approval and potentially capture a US$66.2 million market opportunity at full ICG penetration. Platform Business Transformation UltraGreen.ai is strategically expanding from its traditional dye plus hardware business into an integrated ICG platform through its PerfusionWorks quantification software and cloud platform. The PerfusionWorks software is expected to receive Europe MDR regulatory approval by 2H26, with subsequent US FDA filing planned to use the European dataset. Notably, the software is camera agnostic and can be used with competitors' imaging hardware, making every near-infrared-capable imaging device a potential customer. This approach addresses the critical obstacle of subjectivity in fluorescence imaging assessment by providing objective and reproducible perfusion data, thereby facilitating standardisation required for broader ICG adoption as a standard of care. Growth Strategy and Financial Position The company maintains a robust financial position, with net cash of US$176.1 million and is pursuing growth initiatives worth approximately US$150 million in potential investments or acquisitions across API suppliers, distributors, and lyophilisation companies. UltraGreen.ai also plans to transition from distributor models to direct sales in select markets, reducing distributor fees and enabling direct hospital relationships. This would support the bundling ICG vials with NIR cameras and cross-selling PerfusionWorks software. The research forecasts a 2-year earnings CAGR of 18.6%. Frequently Asked Questions [market_journal_faq] This article has been auto-generated using PhillipGPT. It is based on a report by a Phillip Securities Research analyst. Disclaimer These commentaries are intended for general circulation and do not have regard to the specific investment objectives, financial situation and particular needs of any person. Accordingly, no warranty whatsoever is given and no liability whatsoever is accepted for any loss arising whether directly or indirectly as a result of any person acting based on this information. You should seek advice from a financial adviser regarding the suitability of any investment product(s) mentioned herein, taking into account your specific investment objectives, financial situation or particular needs, before making a commitment to invest in such products. Opinions expressed in these commentaries are subject to change without notice. Investments are subject to investment risks including the possible loss of the principal amount invested. The value of units in any fund and the income from them may fall as well as rise. Past performance figures as well as any projection or forecast used in these commentaries are not necessarily indicative of future or likely performance. Phillip Securities Pte Ltd (PSPL), its directors, connected persons or employees may from time to time have an interest in the financial instruments mentioned in these commentaries. The information contained in these commentaries has been obtained from public sources which PSPL has no reason to believe are unreliable and any analysis, forecasts, projections, expectations and opinions (collectively the “Research”) contained in these commentaries are based on such information and are expressions of belief only. PSPL has not verified this information and no representation or warranty, express or implied, is made that such information or Research is accurate, complete or verified or should be relied upon as such. Any such information or Research contained in these commentaries are subject to change, and PSPL shall not have any responsibility to maintain the information or Research made available or to supply any corrections, updates or releases in connection therewith. In no event will PSPL be liable for any special, indirect, incidental or consequential damages which may be incurred from the use of the information or Research made available, even if it has been advised of the possibility of such damages. The companies and their employees mentioned in these commentaries cannot be held liable for any errors, inaccuracies and/or omissions howsoever caused. Any opinion or advice herein is made on a general basis and is subject to change without notice. The information provided in these commentaries may contain optimistic statements regarding future events or future financial performance of countries, markets or companies. You must make your own financial assessment of the relevance, accuracy and adequacy of the information provided in these commentaries. Views and any strategies described in these commentaries may not be suitable for all investors. Opinions expressed herein may differ from the opinions expressed by other units of PSPL or its connected persons and associates. Any reference to or discussion of investment products or commodities in these commentaries is purely for illustrative purposes only and must not be construed as a recommendation, an offer or solicitation for the subscription, purchase or sale of the investment products or commodities mentioned. This advertisement has not been reviewed by the Monetary Authority of Singapore.
Company Overview Thai Beverage PLC operates as one of Southeast Asia's leading beverage companies, with significant operations spanning alcoholic beverages, including beer and spirits, as well as non-alcoholic products. The company has established itself as a major player in the regional market through its diverse portfolio and strategic investments, including its position as the second-largest shareholder in Vinamilk, one of the Vietnam’s largest dairy companies. Strategic Response to Consumer Pressures Thai Beverage is implementing a comprehensive five-pronged strategy to address the current challenging consumer environment. The company is focusing on smaller pack sizes and stock-keeping units (SKUs) to achieve more affordable price points, recognising that consumers are searching for value during this difficult period. The strategy extends to health and wellness through protein-based non-alcoholic products, whilst offering greater convenience through ready-to-drink (RTD) spirits. The RTD spirits initiative represents a particularly strategic move, as it does not cannibalise existing distilled spirits sales but instead makes products more accessible and convenient for consumers. This category can attract consumers from the beer segment whilst delivering higher gross margins due to lower excise duties compared to beer. Importantly, existing manufacturing capacity already supports RTD spirits production, requiring minimal additional capital expenditure. Financial Outlook and Market Position The company's financial position is expected to strengthen as free cash flow improves following major capital expenditure over the past two years in Cambodia and a dairy farm in Malaysia. This improved balance sheet provides flexibility for potential acquisitions, whilst forward purchases of raw materials are largely hedged for the current financial year's requirements. Phillip Securities Research maintains a BUY recommendation with a target price of S$0.53, highlighting Thai Beverage’s attractive valuations at 10 times FY26e earnings, with a dividend yield of approximately 5.5%. Margins are expected to remain resilient due to lower-priced raw materials purchased and disciplined operating cost management. The potential spinoff of Beerco presents an asset monetisation opportunity, particularly given Southeast Asia's, especially Vietnam's, attractiveness to strategic investors as a growing consumer market. Frequently Asked Questions [market_journal_faq] This article has been auto-generated using PhillipGPT. It is based on a report by a Phillip Securities Research analyst. Disclaimer These commentaries are intended for general circulation and do not have regard to the specific investment objectives, financial situation and particular needs of any person. Accordingly, no warranty whatsoever is given and no liability whatsoever is accepted for any loss arising whether directly or indirectly as a result of any person acting based on this information. You should seek advice from a financial adviser regarding the suitability of any investment product(s) mentioned herein, taking into account your specific investment objectives, financial situation or particular needs, before making a commitment to invest in such products. Opinions expressed in these commentaries are subject to change without notice. Investments are subject to investment risks including the possible loss of the principal amount invested. The value of units in any fund and the income from them may fall as well as rise. Past performance figures as well as any projection or forecast used in these commentaries are not necessarily indicative of future or likely performance. Phillip Securities Pte Ltd (PSPL), its directors, connected persons or employees may from time to time have an interest in the financial instruments mentioned in these commentaries. The information contained in these commentaries has been obtained from public sources which PSPL has no reason to believe are unreliable and any analysis, forecasts, projections, expectations and opinions (collectively the “Research”) contained in these commentaries are based on such information and are expressions of belief only. PSPL has not verified this information and no representation or warranty, express or implied, is made that such information or Research is accurate, complete or verified or should be relied upon as such. Any such information or Research contained in these commentaries are subject to change, and PSPL shall not have any responsibility to maintain the information or Research made available or to supply any corrections, updates or releases in connection therewith. In no event will PSPL be liable for any special, indirect, incidental or consequential damages which may be incurred from the use of the information or Research made available, even if it has been advised of the possibility of such damages. The companies and their employees mentioned in these commentaries cannot be held liable for any errors, inaccuracies and/or omissions howsoever caused. Any opinion or advice herein is made on a general basis and is subject to change without notice. The information provided in these commentaries may contain optimistic statements regarding future events or future financial performance of countries, markets or companies. You must make your own financial assessment of the relevance, accuracy and adequacy of the information provided in these commentaries. Views and any strategies described in these commentaries may not be suitable for all investors. Opinions expressed herein may differ from the opinions expressed by other units of PSPL or its connected persons and associates. Any reference to or discussion of investment products or commodities in these commentaries is purely for illustrative purposes only and must not be construed as a recommendation, an offer or solicitation for the subscription, purchase or sale of the investment products or commodities mentioned. This advertisement has not been reviewed by the Monetary Authority of Singapore.


