Value at Risk
Table of Contents
Value at Risk
Value at Risk (VaR), a statistic used to forecast the biggest potential losses over a certain period, has been termed the “new science of risk management.” It is a well-known and widely used risk assessment method. The VaR model estimates the downside risk of a portfolio and helps investors make informed decisions while managing their risk exposure.
What is value at risk (VaR)?
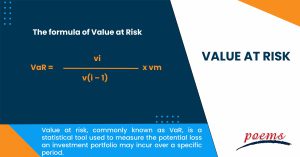
Value at risk, commonly known as VaR, is a statistical tool used to measure the potential loss an investment portfolio may incur over a specific period. VaR is a risk management technique that helps investors estimate the maximum loss they could face in normal market conditions. It is a widely used tool in the financial industry to manage and control risk exposure, especially in the field of investment banking, asset management, and trading.
Understanding value at risk (VaR)
VaR works by analysing the statistical properties of a financial portfolio and estimating the probability of losses beyond a certain threshold. The VaR calculation is based on the historical price movements of the underlying assets and the correlation between them. The VaR value represents the maximum loss the portfolio is expected to incur over a specific period with a given confidence level.
For example, if a portfolio has a VaR of US$100,000 at the 97% confidence level, there is a 3% chance that the portfolio could lose more than US$100,000 over a defined period. Investors can use this information to set risk limits, allocate capital, and make informed decisions about their investment strategies.
VaR is a powerful tool that helps investors understand and manage their investments’ risk. While it has some limitations, such as its dependence on historical data and the assumption of normal market conditions, it remains an essential tool for financial risk management. By using VaR, investors can make informed portfolio decisions and optimise their risk-return trade-offs.
Advantages of value at risk (VaR)
Using VaR in managing risk has several benefits, including:
- You can compare VaR calculations across many asset classes, including currencies, bonds, derivatives, shares, or portfolios.
- It is a singular figure that can be easily understood and is frequently used by experts in the financial sector. It can be stated in price units or as a percentage.
- Due to its prominence, VaR is frequently calculated and included for you in different financial software tools, like a Bloomberg terminal.
Disadvantages of value at risk (VaR)
VaR is frequently criticised for providing a misleading sense of security since it under-reports the highest possible loss. One of its drawbacks is that the statistically most probable outcome isn’t necessarily the actual event.
Furthermore, no standardised method for the statistics is used to assess portfolio, firm-wide, or asset risk. For instance, statistics taken randomly from a time of low volatility may underestimate the likelihood and severity of risk occurrences. Using normally distributed probabilities, which seldom consider extraordinary or “black swan” events, might further underestimate risk.
The fact that the estimate of possible loss indicates the result with the lowest risk is another drawback of Value at Risk. An expectation of losing at least 20% on average once every 20 days, for instance, is represented by a VaR determination of 95% with 20% asset risk. According to this computation, a 50% loss still supports the risk assessment.
Value at risk (VaR) example
For example, an investment manager may use VaR to estimate the maximum potential loss over the next day or week with a 95% confidence level.
To calculate VaR, one must first gather historical data on the investment or portfolio in question, such as prices, returns, and volatility. This data is then used to construct a statistical model, such as a normal distribution or Monte Carlo simulation, to estimate the likelihood of future losses.
The VaR calculation typically involves determining the potential loss at a certain confidence level, such as 95%, over a specific time horizon, such as one day or one week.
VaR may be calculated in a many ways, but the historical technique is the most simple:
VaR = vm (vi / v(i – 1)).
The number of days used to calculate historical data is M.
The number of variables on day i is vi.
The formula’s goal is to calculate each risk factor’s per cent change over the previous 252 trading days. The future value of the security is then calculated for 252 possibilities by applying each per cent change to the security’s existing market values.

Frequently Asked Questions
The two measurements are connected, but they affect risk in distinct ways. Value at risk (VaR) measures the potential losses a portfolio, company, or asset might sustain over a specific time frame. Conversely, standard deviation measures how much profits fluctuate over time.
The additional risks a new investment holding contributes to a company or portfolio are called marginal VaR. Fund managers can better comprehend portfolio changes brought on by the removal or inclusion of a certain investment by using MVaR.
VaR has three main elements- time horizon, confidence level, and portfolio value. The time horizon refers to the period over which the VaR is calculated, and the confidence level represents the probability that the actual loss will not exceed the estimated VaR. The portfolio value is the total value of the assets in the portfolio.
Other factors that may affect the VaR include the volatility of the assets, the correlation between the assets, and the portfolio’s liquidity. VaR is a valuable tool for managing risk in financial markets and helps investors to make informed decisions while managing their portfolios.
A high value for the confidence interval percentage indicates more optimism in the probability of the anticipated outcome. On the other hand, a high value for the expected outcome is not recommended because it statistically predicts a greater cash loss.
Value at Risk (VaR) may be calculated using three approaches: the variance-covariance, historical, and Monte Carlo simulation.
Related Terms
- Trailing Stops
- Exchange Control
- Relevant Cost
- Dow Theory
- Hyperdeflation
- Hope Credit
- Futures contracts
- Human capital
- Subrogation
- Qualifying Annuity
- Strategic Alliance
- Probate Court
- Procurement
- Holding company
- Harmonic mean
- Trailing Stops
- Exchange Control
- Relevant Cost
- Dow Theory
- Hyperdeflation
- Hope Credit
- Futures contracts
- Human capital
- Subrogation
- Qualifying Annuity
- Strategic Alliance
- Probate Court
- Procurement
- Holding company
- Harmonic mean
- Income protection insurance
- Recession
- Savings Ratios
- Pump and dump
- Total Debt Servicing Ratio
- Debt to Asset Ratio
- Liquid Assets to Net Worth Ratio
- Liquidity Ratio
- Personal financial ratios
- T-bills
- Payroll deduction plan
- Operating expenses
- Demand elasticity
- Deferred compensation
- Conflict theory
- Acid-test ratio
- Withholding Tax
- Benchmark index
- Double Taxation Relief
- Debtor Risk
- Securitization
- Yield on Distribution
- Currency Swap
- Overcollateralization
- Efficient Frontier
- Listing Rules
- Green Shoe Options
- Accrued Interest
- Market Order
- Accrued Expenses
- Target Leverage Ratio
- Acceptance Credit
- Balloon Interest
- Abridged Prospectus
- Data Tagging
- Perpetuity
- Hybrid annuity
- Investor fallout
- Intermediated market
- Information-less trades
- Back Months
- Adjusted Futures Price
- Expected maturity date
- Excess spread
- Quantitative tightening
- Accreted Value
- Equity Clawback
- Soft Dollar Broker
- Stagnation
- Replenishment
- Decoupling
- Holding period
- Regression analysis
- Wealth manager
- Financial plan
- Adequacy of coverage
- Actual market
- Credit risk
- Insurance
- Financial independence
- Annual report
- Financial management
- Ageing schedule
- Global indices
- Folio number
- Accrual basis
- Liquidity risk
- Quick Ratio
- Unearned Income
- Sustainability
- Vertical Financial Analysis
- Residual maturity
- Operating Margin
- Trust deed
- Leverage
- Profit and Loss Statement
- Junior Market
- Affinity fraud
- Base currency
- Working capital
- Individual Savings Account
- Redemption yield
- Net profit margin
- Fringe benefits
- Fiscal policy
- Escrow
- Externality
- Multi-level marketing
- Joint tenancy
- Liquidity coverage ratio
- Hurdle rate
- Kiddie tax
- Giffen Goods
- Keynesian economics
- EBITA
- Risk Tolerance
- Disbursement
- Bayes’ Theorem
- Amalgamation
- Adverse selection
- Contribution Margin
- Accounting Equation
- Value chain
- Gross Income
- Net present value
- Liability
- Leverage ratio
- Inventory turnover
- Gross margin
- Collateral
- Being Bearish
- Being Bullish
- Commodity
- Exchange rate
- Basis point
- Inception date
- Riskometer
- Trigger Option
- Zeta model
- Racketeering
- Market Indexes
- Short Selling
- Quartile rank
- Defeasance
- Cut-off-time
- Business-to-Consumer
- Bankruptcy
- Acquisition
- Turnover Ratio
- Indexation
- Fiduciary responsibility
- Benchmark
- Pegging
- Illiquidity
- Backwardation
- Backup Withholding
- Buyout
- Beneficial owner
- Contingent deferred sales charge
- Exchange privilege
- Asset allocation
- Maturity distribution
- Letter of Intent
- Emerging Markets
- Consensus Estimate
- Cash Settlement
- Cash Flow
- Capital Lease Obligations
- Book-to-Bill-Ratio
- Capital Gains or Losses
- Balance Sheet
- Capital Lease
Most Popular Terms
Other Terms
- Adjusted distributed income
- International securities exchanges
- Settlement currency
- Federal funds rate
- Active Tranche
- Convertible Securities
- Synthetic ETF
- Physical ETF
- Initial Public Offering
- Buyback
- Secondary Sharing
- Bookrunner
- Notional amount
- Negative convexity
- Jumbo pools
- Inverse floater
- Forward Swap
- Underwriting risk
- Reinvestment risk
- Final Maturity Date
- Payment Date
- Secondary Market
- Margin Requirement
- Mark-to-market
- Pledged Asset
- Yield Pickup
- Subordinated Debt
- Treasury Stock Method
- Stochastic Oscillator
- Bullet Bonds
- Basket Trade
- Contrarian Strategy
- Notional Value
- Speculation
- Stub
- Trading Volume
- Going Long
- Pink sheet stocks
- Rand cost averaging
- Sustainable investment
- Stop-limit sell order
- Economic Bubble
- Ask Price
- Constant prepayment rate
- Covenants
- Stock symbol
- Companion tranche
- Synthetic replication
- Bourse
- Beneficiary
Know More about
Tools/Educational Resources
Markets Offered by POEMS
Read the Latest Market Journal

Navigating the vast world of unit trusts can be daunting. With nearly 2000 funds available...

Predicting Trend Reversals with Candlestick Patterns for Beginners
Candlestick patterns are used to predict the future direction of price movements as they contain...

In the diverse and complex world of investing, unit trusts stand out as a popular...

Back in Business: The Return of IPOs & Top Traded Counters in March 2024
Start trading on POEMS! Open a free account here! At a glance: Major indices continue...

Weekly Updates 15/4/24 – 19/4/24
This weekly update is designed to help you stay informed and relate economic and company...

From $50 to $100: Unveiling the Impact of Inflation
In recent years, inflation has become a hot topic, evoking strong emotions as the cost...

Japan’s Economic Resurgence: Unveiling the Tailwinds Behind Nikkei 225’s Record Leap
Source: eSignal, Intercontinental Exchange, Inc. In the heart of Japan’s economic landscape, the Nikkei 225...

Weekly Updates 8/4/24 – 12/4/24
This weekly update is designed to help you stay informed and relate economic and...


