Capital Gains or Losses
Table of Contents
What is a capital gain or capital loss?
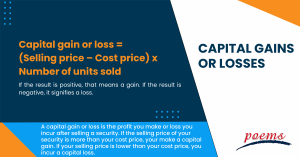
A capital gain or loss is the profit you make or loss you incur after selling a security. If the selling price of your security is more than your cost price, your make a capital gain. If your selling price is lower than your cost price, you incur a capital loss.
How do you calculate capital gains or losses?
Capital gain or loss = (Selling price – Cost price) x Number of units sold
If the result is positive, that means a gain. If the result is negative, it signifies a loss.
Examples of capital gain and loss
Suppose an investor buys 100 shares at US$20 each. His total cost of investment is US$2,000.
If he sells his shares at US$22 per share, he makes a capital gain of US$200.
Capital gain = (Selling price – Cost price) x 100 = (US$22 – US$20) x 100 = US$200
If he sells each share at US$17, he bears a capital loss of US$300.
Capital loss = (US$17 – US$20) x 100 = (-US$3) x 100 = -US$300
Short-term and long-term capital gains and losses
In the US and several other countries, capital gains are subject to taxation, which varies based on whether they are long-term or short-term. Long-term capital gains come from assets held for over a year, while short-term capital gains are from assets sold within one year or less. Certain countries, such as Singapore, do not impose a capital gains tax.
What are unrealised gains and losses?
Unrealised gains occur when the value of your investment goes up but you haven’t sold it. Similarly, if the value of your investment falls and you haven’t sold it, your loss is an unrealised loss.
Unrealised gains and losses are also known as paper gains and losses since they become actual gains and losses only when you sell them.
Frequently Asked Questions
When your total capital gains for the year outweigh your total capital losses, you will end up with a net capital gain for the year. Similarly, when your total capital losses for the year outweigh your total capital gains, you will end up with a net capital loss for the year.
It varies from country to country.
Most stock dividends in the US qualify to be taxed as capital gains. The tax rate for dividend income depends on whether the dividends are ordinary or qualified. A qualified dividend is taxed at the capital gains tax rate. Ordinary dividends are taxed at standard federal income tax rates.
In Singapore, dividends paid by resident companies are not taxed. Foreign dividends received by individual residents in Singapore are also non-taxable. If an individual resident in Singapore receives foreign-sourced dividends through a partnership in Singapore, these dividends may be exempted from Singapore tax if certain conditions are met.
Consider investing for the long term. Holding an asset for over a year qualifies you for the lower long-term capital gains tax rate, which is typically much lower than the short-term rate in the US. Additionally, you can offset gains with capital losses by selling underperforming assets that no longer align with your investment goals before the financial year ends. This strategy allows you to use the capital loss to offset gains from other assets, helping you manage tax liabilities and freeing up funds for better investment opportunities.
Capital gains refer to the profits earned from selling investments like stocks, bonds, or real estate. These gains are taxed at a lower rate than ordinary income, offering investors a tax advantage compared to wage earners. Additionally, capital losses may be used to reduce one’s overall tax liability in some cases.
Related Terms
- Cost of Equity
- Capital Adequacy Ratio (CAR)
- Interest Coverage Ratio
- Industry Groups
- Income Statement
- Historical Volatility (HV)
- Embedded Options
- Dynamic Asset Allocation
- Depositary Receipts
- Deferment Payment Option
- Debt-to-Equity Ratio
- Financial Futures
- Contingent Capital
- Conduit Issuers
- Calendar Spread
- Devaluation
- Grading Certificates
- Distributable Net Income
- Cover Order
- Tracking Index
- Auction Rate Securities
- Arbitrage-Free Pricing
- Net Profits Interest
- Borrowing Limit
- Algorithmic Trading
- Corporate Action
- Spillover Effect
- Economic Forecasting
- Treynor Ratio
- Hammer Candlestick
- DuPont Analysis
- Net Profit Margin
- Law of One Price
- Annual Value
- Rollover option
- Financial Analysis
- Currency Hedging
- Lump sum payment
- Annual Percentage Yield (APY)
- Excess Equity
- Fiduciary Duty
- Bought-deal underwriting
- Anonymous Trading
- Fair Market Value
- Fixed Income Securities
- Redemption fee
- Acid Test Ratio
- Bid Ask price
- Finance Charge
- Futures
- Basis grades
- Short Covering
- Visible Supply
- Transferable notice
- Intangibles expenses
- Strong order book
- Fiat money
- Trailing Stops
- Exchange Control
- Relevant Cost
- Dow Theory
- Hyperdeflation
- Hope Credit
- Futures contracts
- Human capital
- Subrogation
- Qualifying Annuity
- Strategic Alliance
- Probate Court
- Procurement
- Holding company
- Harmonic mean
- Income protection insurance
- Recession
- Savings Ratios
- Pump and dump
- Total Debt Servicing Ratio
- Debt to Asset Ratio
- Liquid Assets to Net Worth Ratio
- Liquidity Ratio
- Personal financial ratios
- Payroll deduction plan
- Operating expenses
- Demand elasticity
- Deferred compensation
- Conflict theory
- Acid-test ratio
- Withholding Tax
- Benchmark index
- Double Taxation Relief
- Debtor Risk
- Securitization
- Yield on Distribution
- Currency Swap
- Overcollateralization
- Efficient Frontier
- Listing Rules
- Green Shoe Options
- Accrued Interest
- Market Order
- Accrued Expenses
- Target Leverage Ratio
- Acceptance Credit
- Balloon Interest
- Abridged Prospectus
- Data Tagging
- Perpetuity
- Optimal portfolio
- Hybrid annuity
- Investor fallout
- Intermediated market
- Information-less trades
- Back Months
- Adjusted Futures Price
- Expected maturity date
- Excess spread
- Quantitative tightening
- Accreted Value
- Equity Clawback
- Soft Dollar Broker
- Stagnation
- Replenishment
- Decoupling
- Holding period
- Regression analysis
- Wealth manager
- Financial plan
- Adequacy of coverage
- Actual market
- Credit risk
- Insurance
- Financial independence
- Annual report
- Financial management
- Ageing schedule
- Global indices
- Folio number
- Accrual basis
- Liquidity risk
- Quick Ratio
- Unearned Income
- Sustainability
- Value at Risk
- Vertical Financial Analysis
- Residual maturity
- Operating Margin
- Trust deed
- Profit and Loss Statement
- Junior Market
- Affinity fraud
- Base currency
- Working capital
- Individual Savings Account
- Redemption yield
- Net profit margin
- Fringe benefits
- Fiscal policy
- Escrow
- Externality
- Multi-level marketing
- Joint tenancy
- Liquidity coverage ratio
- Hurdle rate
- Kiddie tax
- Giffen Goods
- Keynesian economics
- EBITA
- Risk Tolerance
- Disbursement
- Bayes’ Theorem
- Amalgamation
- Adverse selection
- Contribution Margin
- Accounting Equation
- Value chain
- Gross Income
- Net present value
- Liability
- Leverage ratio
- Inventory turnover
- Gross margin
- Collateral
- Being Bearish
- Being Bullish
- Commodity
- Exchange rate
- Basis point
- Inception date
- Riskometer
- Trigger Option
- Zeta model
- Racketeering
- Market Indexes
- Short Selling
- Quartile rank
- Defeasance
- Cut-off-time
- Business-to-Consumer
- Bankruptcy
- Acquisition
- Turnover Ratio
- Indexation
- Fiduciary responsibility
- Benchmark
- Pegging
- Illiquidity
- Backwardation
- Backup Withholding
- Buyout
- Beneficial owner
- Contingent deferred sales charge
- Exchange privilege
- Asset allocation
- Maturity distribution
- Letter of Intent
- Emerging Markets
- Consensus Estimate
- Cash Settlement
- Cash Flow
- Capital Lease Obligations
- Book-to-Bill-Ratio
- Balance Sheet
- Capital Lease
Most Popular Terms
Other Terms
- Variable Annuity
- Asset Swaps
- Anchoring Bias
- Alpha Capture
- Bond Convexity
- Compound Yield
- Brokerage Account
- Discretionary Accounts
- Industry Groups
- Growth Rate
- Green Bond Principles
- Gamma Scalping
- Funding Ratio
- Free-Float Methodology
- Foreign Direct Investment (FDI)
- Floating Dividend Rate
- Flight to Quality
- Real Return
- Protective Put
- Perpetual Bond
- Option Adjusted Spread (OAS)
- Non-Diversifiable Risk
- Merger Arbitrage
- Liability-Driven Investment (LDI)
- Income Bonds
- Guaranteed Investment Contract (GIC)
- Flash Crash
- Equity Carve-Outs
- Cost Basis
- Deferred Annuity
- Cash-on-Cash Return
- Earning Surprise
- Bubble
- Beta Risk
- Bear Spread
- Asset Play
- Accrued Market Discount
- Ladder Strategy
- Junk Status
- Intrinsic Value of Stock
- Interest-Only Bonds (IO)
- Inflation Hedge
- Incremental Yield
- Industrial Bonds
- Holding Period Return
- Hedge Effectiveness
- Flat Yield Curve
- Fallen Angel
- Exotic Options
- Execution Risk
Know More about
Tools/Educational Resources
Markets Offered by POEMS
Read the Latest Market Journal

Wells Fargo Maintains Growth Momentum Despite Rate Headwinds
Overview Wells Fargo reported third-quarter 2026 earnings of US$6 billion, up 6% year-on-year, though below analyst estimates due to lower net interest income and trading gains. Investment advisory fees rose 15% as client assets grew, while investment banking fees increased 6% from market share gains. The company maintained its BUY rating with a reduced target price of US$105, down from US$115. Investment Positives Wells Fargo demonstrated strong operational efficiency through successful cost management initiatives. Expenses fell 1% year-on-year despite a 15% increase in revenue-related expenses, as non-revenue-related expenses declined 4%. The bank achieved this through workforce optimisation, with headcount falling 8% year-on-year to 194,000, marking the 24th consecutive quarterly decline. This drove efficiency ratio improvement to 63% from 65% in the prior year, with management expecting to absorb approximately US$400 million of higher revenue-related expenses within unchanged full-year guidance. The bank's commercial client franchise powered impressive balance sheet growth. Average loans surged 11% year-on-year to US$1.03 trillion, led by Corporate and Investment Banking (+19%), Wealth and Investment Management securities-based lending (+16%), and Commercial Banking (+10%). Deposits mirrored this growth, rising 11% year-on-year to US$1.48 trillion, with Corporate and Investment Banking up 22% and Commercial Banking advancing 16%. Auto balances showed particularly strong momentum, climbing 31% year-on-year. Credit quality metrics remained robust throughout this expansion. The net charge-off ratio improved to 0.38% from 0.40% in the prior year quarter, whilst nonperforming assets declined to 0.70% of loans from 0.83%. Investment advisory fees benefited from market tailwinds, rising 15% year-on-year as higher stock and bond prices lifted Wealth and Investment Management client assets by 11%. Investment banking fees grew 6% year-on-year as strategic hiring enhanced market share in mergers and acquisitions and equity capital markets. Challenges Lower interest rates compressed loan yields, offsetting the benefit of strong loan growth on net interest income performance. A sharp move in interest rates in late September also slowed client activity in fixed income, currencies and commodities, impacting trading revenues. The bank faced headwinds from lost lease income following its rail car business sale and lower mortgage banking fees, which left non-interest income down 1% year-on-year despite gains in other areas. Outlook Wells Fargo maintained its full-year 2026 net interest income guidance at approximately US$50 billion, though it lowered Markets net interest income expectations to approximately US$1.8 billion from the previous US$2 billion estimate. The bank expects continued earnings growth from balance sheet expansion capabilities, with maturing card vintages and investment banking share gains contributing to earnings into fiscal year 2027. The company targets return on tangible common equity of 17% to 18%, supported by ongoing cost discipline and revenue growth initiatives. Recommendation & Target Price Phillip Securities Research maintains a BUY recommendation on Wells Fargo with a target price of US$105, reduced from the previous US$115. The firm lowered fiscal year 2026 earnings estimates by 8% due to reduced net interest income, investment advisory, and other non-interest income projections. The valuation assumes 1.85x fiscal year 2026 price-to-book value and return on equity estimate of 16.7%. Frequently Asked Questions [market_journal_faq] This article has been auto-generated using PhillipGPT. It is based on a report by a Phillip Securities Research analyst. Disclaimer Disclaimer These commentaries are intended for general circulation and do not have regard to the specific investment objectives, financial situation and particular needs of any person. Accordingly, no warranty whatsoever is given and no liability whatsoever is accepted for any loss arising whether directly or indirectly as a result of any person acting based on this information. You should seek advice from a financial adviser regarding the suitability of any investment product(s) mentioned herein, taking into account your specific investment objectives, financial situation or particular needs, before making a commitment to invest in such products. Opinions expressed in these commentaries are subject to change without notice. Investments are subject to investment risks including the possible loss of the principal amount invested. The value of units in any fund and the income from them may fall as well as rise. Past performance figures as well as any projection or forecast used in these commentaries are not necessarily indicative of future or likely performance. Phillip Securities Pte Ltd (PSPL), its directors, connected persons or employees may from time to time have an interest in the financial instruments mentioned in these commentaries. The information contained in these commentaries has been obtained from public sources which PSPL has no reason to believe are unreliable and any analysis, forecasts, projections, expectations and opinions (collectively the “Research”) contained in these commentaries are based on such information and are expressions of belief only. PSPL has not verified this information and no representation or warranty, express or implied, is made that such information or Research is accurate, complete or verified or should be relied upon as such. Any such information or Research contained in these commentaries are subject to change, and PSPL shall not have any responsibility to maintain the information or Research made available or to supply any corrections, updates or releases in connection therewith. In no event will PSPL be liable for any special, indirect, incidental or consequential damages which may be incurred from the use of the information or Research made available, even if it has been advised of the possibility of such damages. The companies and their employees mentioned in these commentaries cannot be held liable for any errors, inaccuracies and/or omissions howsoever caused. Any opinion or advice herein is made on a general basis and is subject to change without notice. The information provided in these commentaries may contain optimistic statements regarding future events or future financial performance of countries, markets or companies. You must make your own financial assessment of the relevance, accuracy and adequacy of the information provided in these commentaries. Views and any strategies described in these commentaries may not be suitable for all investors. Opinions expressed herein may differ from the opinions expressed by other units of PSPL or its connected persons and associates. Any reference to or discussion of investment products or commodities in these commentaries is purely for illustrative purposes only and must not be construed as a recommendation, an offer or solicitation for the subscription, purchase or sale of the investment products or commodities mentioned. This advertisement has not been reviewed by the Monetary Authority of Singapore.

Raffles Education Set for Growth Pivot as Focus Shifts to ASEAN K-12 Expansion
Brief Overview Phillip Securities Research has initiated coverage on Raffles Education with a BUY rating, citing the company's strategic pivot towards ASEAN K-12 expansion whilst divesting lower-return assets. The firm expects the education group to return to net cash through substantial asset monetisations exceeding S$500 million in gross proceeds, which will fund growth initiatives across Thailand, Malaysia and Indonesia. Investment Positives Strengthening ASEAN Regional Presence Raffles Education is strategically expanding its K-12 education footprint through Malaysia, Thailand and Indonesia. The analyst believes the company is well-positioned to capitalise on two key trends: the increasing regionalisation of higher education within Asia and the expanding base of affluent locals driving demand for international schools. Visa restrictions, rising tuition fees, and policy uncertainty in the US and UK are expected to redirect outbound Asian education demand back towards the ASEAN region. This shift is already evident in strong enrolment trends, with Raffles University enrolment more than doubling from 438 students in 2022 to 1,002 in 2025. Strategic Asset Disposal Programme The company has embarked on a comprehensive asset disposal strategy, having already sold its 51 Merchant Road property in Singapore for S$121.8 million (generating a S$52.3 million gain) and Wanbo College, Hefei, for S$78.4 million in FY26. The analyst expects additional asset divestments worth more than S$500 million in gross proceeds before tax deductions. These lower-return assets are primarily vacant land or China-based properties, with ASEAN assets demonstrating superior efficiency at 0.22x revenue per dollar of non-current assets versus China's 0.09x. The disposal of low-return China assets will transform Raffles Education into a more ASEAN-focused business, potentially narrowing its valuation gap to Southeast Asian peers. Robust Local Demand Foundation Most of Raffles Education's assets benefit from strong affluent local demand, with only Raffles Singapore and RAS Iskandar relying on expatriate populations. The analyst expects increased investment in Southeast Asia to expand the base of affluent locals through several major infrastructure and economic development projects. These include the RTS link and Johor-Singapore Special Economic Zone, Thailand's Eastern Economic Corridor special economic zone, and Indonesia's participation in the Belt and Road project, all of which are expected to drive job creation and inward investment, supporting demand for international schooling. Challenges The report does not explicitly outline significant investment challenges or negative factors for Raffles Education, focusing primarily on the positive transformation and growth opportunities ahead. Outlook The analyst projects Raffles Education will achieve net cash status by FY27/28, supported by the substantial asset disposal programme and improved operational efficiency from focusing on higher-return ASEAN markets. The company's current valuation of approximately 11x FY27e EV/EBITDA appears attractive given the strategic transformation underway. Recommendation & Target Price Phillip Securities Research initiates coverage with a BUY rating and target price of S$0.20. The valuation is based on DCF analysis using a 7% WACC and 7.5x EV/EBITDA exit multiple derived from peer comparables. The analyst notes that the target price is conservative, incorporating dilution from warrants and approximately S$35 million of resulting cash proceeds. Frequently Asked Questions [market_journal_faq] This article has been auto-generated using PhillipGPT. It is based on a report by a Phillip Securities Research analyst. Disclaimer These commentaries are intended for general circulation and do not have regard to the specific investment objectives, financial situation and particular needs of any person. Accordingly, no warranty whatsoever is given and no liability whatsoever is accepted for any loss arising whether directly or indirectly as a result of any person acting based on this information. You should seek advice from a financial adviser regarding the suitability of any investment product(s) mentioned herein, taking into account your specific investment objectives, financial situation or particular needs, before making a commitment to invest in such products. Opinions expressed in these commentaries are subject to change without notice. Investments are subject to investment risks including the possible loss of the principal amount invested. The value of units in any fund and the income from them may fall as well as rise. Past performance figures as well as any projection or forecast used in these commentaries are not necessarily indicative of future or likely performance. Phillip Securities Pte Ltd (PSPL), its directors, connected persons or employees may from time to time have an interest in the financial instruments mentioned in these commentaries. The information contained in these commentaries has been obtained from public sources which PSPL has no reason to believe are unreliable and any analysis, forecasts, projections, expectations and opinions (collectively the “Research”) contained in these commentaries are based on such information and are expressions of belief only. PSPL has not verified this information and no representation or warranty, express or implied, is made that such information or Research is accurate, complete or verified or should be relied upon as such. Any such information or Research contained in these commentaries are subject to change, and PSPL shall not have any responsibility to maintain the information or Research made available or to supply any corrections, updates or releases in connection therewith. In no event will PSPL be liable for any special, indirect, incidental or consequential damages which may be incurred from the use of the information or Research made available, even if it has been advised of the possibility of such damages. The companies and their employees mentioned in these commentaries cannot be held liable for any errors, inaccuracies and/or omissions howsoever caused. Any opinion or advice herein is made on a general basis and is subject to change without notice. The information provided in these commentaries may contain optimistic statements regarding future events or future financial performance of countries, markets or companies. You must make your own financial assessment of the relevance, accuracy and adequacy of the information provided in these commentaries. Views and any strategies described in these commentaries may not be suitable for all investors. Opinions expressed herein may differ from the opinions expressed by other units of PSPL or its connected persons and associates. Any reference to or discussion of investment products or commodities in these commentaries is purely for illustrative purposes only and must not be construed as a recommendation, an offer or solicitation for the subscription, purchase or sale of the investment products or commodities mentioned. This advertisement has not been reviewed by the Monetary Authority of Singapore.

Nanofilm Technologies Targets Growth Through Commercialisation of Deep Tech Solutions
Brief Overview Phillip Securities Research expects Nanofilm Technologies to benefit from higher demand for its functional hinge coatings driven by customer Z's foldable phone launch in 4Q26e, whilet the company's proprietary coating solutions are moving from R&D into commercial applications across semiconductor, industrial, and automotive sectors. The research house anticipates that the Industrial Equipment Business Unit revenue could increase more than 35% from FY25 to FY27e as products transition to commercialisation. Investment Positives The investment case centres on Nanofilm's expanding opportunities across multiple business segments. In the 3C sector, customer Z's new foldable phone model launching in 4Q26e is expected to drive demand for Nanofilm's functional hinge coatings. Additionally, customer Z has transitioned premium-tier smartwatch housings from aluminium to titanium, expanding Nanofilm's decorative coating product range. These new 3C programmes are expected to ramp up in 2H26e and into 2027e, potentially driving Advanced Materials Business Unit revenue up more than 25% from FY25 to FY27e. The commercialisation of new products presents significant growth potential. Several products are reaching the commercialisation stage, particularly in printed circuit board drills, advanced packaging, and hydrogen fuel cells. Nanofilm's rainbow tetrahedral amorphous carbon extends PCB drill bit life by 3.3x, addressing growing needs as layers increase in AI server boards. The company's approximately 1-nanometre barrier coating providessolutions for 3D AI packaging by evenly lining deep, narrow through-silicon vias (TSVs) and through-glass vias (TGVs) that conventional sputtering struggles to coat. Notably, Sydrogen secured new business worth at least tens of millions in revenue with a leading Chinese automaker for its SydroDIAMOND hydrogen fuel cell coating. Operational improvements are driving margin expansion. Since the founder returned as CEO in January 2025, there has been a refocus from R&D to commercialisation, workshop consolidation in Singapore and China, and prioritisation of asset utilisation. Gross margins expanded by 6 percentage points year-on-year to 39% in 1H26, the highest since FY22. Challenges The report does not explicitly identify specific investment risks or challenges facing Nanofilm Technologies. Outlook With Nanofilm's cost base largely fixed through staff costs and depreciation making up about two-thirds of FY25 expenses, rising volumes should flow through to margins. The major capex cycle is largely complete, and new 3C, semiconductor, industrial and automotive programmes are expected to raise utilisation from 2H26e into 2027e. This should lift net margin from 4.9% in FY25 to 8.6% in FY27e, with the ramp-up and stabilisation of new programmes expected to drive net profit growth by more than 75% from FY25 to FY27e. Recommendation & Target Price Phillip Securities Research initiates coverage with a BUY recommendation and target price of S$1.20. The target price is based on 28x FY27e P/E, in line with peers' average. Frequently Asked Questions [market_journal_faq] This article has been auto-generated using PhillipGPT. It is based on a report by a Phillip Securities Research analyst. Disclaimer These commentaries are intended for general circulation and do not have regard to the specific investment objectives, financial situation and particular needs of any person. Accordingly, no warranty whatsoever is given and no liability whatsoever is accepted for any loss arising whether directly or indirectly as a result of any person acting based on this information. You should seek advice from a financial adviser regarding the suitability of any investment product(s) mentioned herein, taking into account your specific investment objectives, financial situation or particular needs, before making a commitment to invest in such products. Opinions expressed in these commentaries are subject to change without notice. Investments are subject to investment risks including the possible loss of the principal amount invested. The value of units in any fund and the income from them may fall as well as rise. Past performance figures as well as any projection or forecast used in these commentaries are not necessarily indicative of future or likely performance. Phillip Securities Pte Ltd (PSPL), its directors, connected persons or employees may from time to time have an interest in the financial instruments mentioned in these commentaries. The information contained in these commentaries has been obtained from public sources which PSPL has no reason to believe are unreliable and any analysis, forecasts, projections, expectations and opinions (collectively the “Research”) contained in these commentaries are based on such information and are expressions of belief only. PSPL has not verified this information and no representation or warranty, express or implied, is made that such information or Research is accurate, complete or verified or should be relied upon as such. Any such information or Research contained in these commentaries are subject to change, and PSPL shall not have any responsibility to maintain the information or Research made available or to supply any corrections, updates or releases in connection therewith. In no event will PSPL be liable for any special, indirect, incidental or consequential damages which may be incurred from the use of the information or Research made available, even if it has been advised of the possibility of such damages. The companies and their employees mentioned in these commentaries cannot be held liable for any errors, inaccuracies and/or omissions howsoever caused. Any opinion or advice herein is made on a general basis and is subject to change without notice. The information provided in these commentaries may contain optimistic statements regarding future events or future financial performance of countries, markets or companies. You must make your own financial assessment of the relevance, accuracy and adequacy of the information provided in these commentaries. Views and any strategies described in these commentaries may not be suitable for all investors. Opinions expressed herein may differ from the opinions expressed by other units of PSPL or its connected persons and associates. Any reference to or discussion of investment products or commodities in these commentaries is purely for illustrative purposes only and must not be construed as a recommendation, an offer or solicitation for the subscription, purchase or sale of the investment products or commodities mentioned. This advertisement has not been reviewed by the Monetary Authority of Singapore.

JPMorgan Chase Maintains ACCUMULATE Rating Despite Lower Target Price
Brief Overview JPMorgan Chase reported 3Q26 adjusted earnings of US$15.8bn, representing a 10% year-on-year increase but falling short of analyst estimates. The performance was impacted by weaker-than-expected Fixed Income trading and investment banking fees, as client activity in Rates, Credit and Commodities weakened following a late September bond sell-off. Despite earnings growth, share buybacks declined significantly to US$1.1bn from US$8.3bn in the prior year, whilst dividends per share increased 10% to US$1.65. Investment Positives Prime financing emerged as a key growth driver, significantly boosting Equity Markets performance and Markets net interest income. Equity Markets revenue surged 49% year-on-year to US$5.0bn, driven by Prime and Derivatives activities. This growth expanded the balance sheet substantially, with average Markets interest-earning assets rising 20% year-on-year to US$1.7tn. The yield on these assets improved markedly to 0.57% from 0.19% in 3Q25, propelling Markets NII to US$2.4bn compared to US$0.7bn previously. The Consumer & Community Banking division delivered strong performance with net income rising 13% year-on-year to US$5.7bn. Card Services & Auto revenue increased 15% year-on-year, supported by 7% card loan growth and an improved card net revenue rate of 10.76% versus 10.03% in 3Q25. Deposit growth remained healthy at 4% year-on-year, bolstered by 650,000 net new checking accounts. Asset management fees rose 15% year-on-year on higher market levels and net inflows. Credit quality showed improvement with the Card net charge-off rate declining to 2.91% from 3.15%, whilst firmwide net charge-offs fell US$389mn year-on-year due to lower wholesale charge-offs. Management raised FY26 NII guidance to approximately US$106.2bn from US$105.5bn previously, with 2027 central case NII ex-Markets projected at US$107bn. Challenges Fixed Income trading faced headwinds with revenue declining 4% due to lower performance in Commodities, Rates and Credit segments. Investment banking deals stalled following the late September bond sell-off, contributing to underperformance relative to expectations. Principal transactions showed weakness, leading to downward revisions in earnings estimates. Adjusted expense guidance was raised to approximately US$108.6bn from US$107.5bn previously, indicating cost pressures. Outlook Phillip Securities Research maintains a positive outlook on JPMorgan Chase, highlighting the bank's earnings diversity and asset-sensitive balance sheet as key strengths. Rate hikes are expected to contribute to NII growth in 2027, with approximately a quarter of projected growth stemming from rate increases. Prime financing and advisory services are positioned to deliver fee growth independent of rate movements. Management's strategy to redirect capital from buybacks into loans is expected to generate returns exceeding the approximately 6% earnings yield on shares, supporting book value growth into FY27. Recommendation & Target Price Phillip Securities Research maintains an ACCUMULATE recommendation for JPMorgan Chase with a revised target price of US$370, reduced from the previous US$380. The target price reduction reflects a 3% decrease in FY26 earnings estimates due to lower principal transactions, asset management and investment banking projections. The valuation assumes 2.93x FY26 price-to-book value and a return on equity estimate of 23.0%. Frequently Asked Questions [market_journal_faq] This article has been auto-generated using PhillipGPT. It is based on a report by a Phillip Securities Research analyst. Disclaimer These commentaries are intended for general circulation and do not have regard to the specific investment objectives, financial situation and particular needs of any person. Accordingly, no warranty whatsoever is given and no liability whatsoever is accepted for any loss arising whether directly or indirectly as a result of any person acting based on this information. You should seek advice from a financial adviser regarding the suitability of any investment product(s) mentioned herein, taking into account your specific investment objectives, financial situation or particular needs, before making a commitment to invest in such products. Opinions expressed in these commentaries are subject to change without notice. Investments are subject to investment risks including the possible loss of the principal amount invested. The value of units in any fund and the income from them may fall as well as rise. Past performance figures as well as any projection or forecast used in these commentaries are not necessarily indicative of future or likely performance. Phillip Securities Pte Ltd (PSPL), its directors, connected persons or employees may from time to time have an interest in the financial instruments mentioned in these commentaries. The information contained in these commentaries has been obtained from public sources which PSPL has no reason to believe are unreliable and any analysis, forecasts, projections, expectations and opinions (collectively the “Research”) contained in these commentaries are based on such information and are expressions of belief only. PSPL has not verified this information and no representation or warranty, express or implied, is made that such information or Research is accurate, complete or verified or should be relied upon as such. Any such information or Research contained in these commentaries are subject to change, and PSPL shall not have any responsibility to maintain the information or Research made available or to supply any corrections, updates or releases in connection therewith. In no event will PSPL be liable for any special, indirect, incidental or consequential damages which may be incurred from the use of the information or Research made available, even if it has been advised of the possibility of such damages. The companies and their employees mentioned in these commentaries cannot be held liable for any errors, inaccuracies and/or omissions howsoever caused. Any opinion or advice herein is made on a general basis and is subject to change without notice. The information provided in these commentaries may contain optimistic statements regarding future events or future financial performance of countries, markets or companies. You must make your own financial assessment of the relevance, accuracy and adequacy of the information provided in these commentaries. Views and any strategies described in these commentaries may not be suitable for all investors. Opinions expressed herein may differ from the opinions expressed by other units of PSPL or its connected persons and associates. Any reference to or discussion of investment products or commodities in these commentaries is purely for illustrative purposes only and must not be construed as a recommendation, an offer or solicitation for the subscription, purchase or sale of the investment products or commodities mentioned. This advertisement has not been reviewed by the Monetary Authority of Singapore.

Maximizing Retirement Wealth: How to Invest CPF-OA and SRS in SGX ETFs
For working professionals in Singapore, building a comfortable retirement nest egg requires more than just relying on monthly salary savings. The Singapore government offers two powerful retirement savings vehicles: the Central Provident Fund Ordinary Account (CPF-OA) and the Supplementary Retirement Scheme (SRS). While keeping cash in these accounts guarantees safety, holding idle funds during inflationary periods risks eroding your long-term purchasing power. By strategically investing CPF-OA and SRS funds into Exchange-Traded Funds (ETFs) listed on the Singapore Exchange (SGX), you can harness market growth while enjoying tax efficiency. 1. The Baseline: Understanding Your Minimum Target Returns Before investing, consider both the returns you may gain by keeping your money in its existing account and the potential benefits and risks of investing it instead. As a rule of thumb, your expected investment returns should be higher than the risk-free interest rate guaranteed by each account since investing involves taking on greater risks: · CPF-OA Target Return (2.50% p.a. base): CPF-OA provides a risk-free guaranteed return of 2.5% per year (and up to 3.5% on the first S$20,000 of OA balance via extra CPF interest). Additional CPF interest may also apply to eligible balances, depending on your age and total CPF savings. However, additional interest earned on OA savings is credited to your Special Account or Retirement Account, rather than retained in the OA. Investing your CPF-OA only makes sense if your target portfolio can consistently yield 5.0%–7.0% per year over a long horizon (10+ years). · SRS Target Return (0.05% p.a. base): The SRS is a voluntary retirement savings scheme that offers tax benefits to eligible contributors. Uninvested cash in an SRS account earns a basic bank savings rate of just 0.05% per year. Leaving SRS funds idle will result in a loss of buying power to inflation over time. The Power of Compounding S$10,000 Over 20 Years Investment Strategy Projected Return (p.a.) Value After 20 Years Idle in SRS 0.05% ~S$10,100 Idle in CPF-OA (Base Rate) 2.50% ~S$16,386 Core SGX ETF Strategy 6.50% (Projected) ~S$35,236 Investing SRS funds gives you the opportunity to seek higher returns over time, although this comes with investment risk. The choice of investments should reflect your financial objectives, risk tolerance and retirement timeline. 2. Option 1: Investing CPF-OA via CPFIS Rules & Eligibility To invest CPF-OA funds under the CPF Investment Scheme (CPFIS-OA), you must: Be at least 20 years old and not an undischarged bankrupt. Maintain a mandatory minimum balance of S$20,000 in your CPF-OA (only funds above S$20,000 can be invested). Complete the online CPFIS Self-Assessment Test (SAT). Opened a CPF Investment Account with one of the three approved agent banks Note: Not all investments are eligible under CPFIS. Investors should check the scheme's requirements and the eligibility of specific products before committing their savings. Popular CPFIS-Approved SGX ETFs CPFIS sets strict limits on management fees and risk levels. Top approved ETFs on SGX include: Ticker ETF Name Asset Class / Focus CPFIS Risk Level ES3.SI SPDR Straits Times Index ETF Top 30 Singapore Listed Companies Low to Medium Risk G3B.SI Nikko AM Singapore STI ETF Top 30 Singapore Listed Companies Low to Medium Risk A35.SI ABF Singapore Bond Index Fund Singapore Government & AAA-Rated Bonds Low Risk 3. Option 2: Supercharging Retirement with the Supplementary Retirement Scheme (SRS) Tax Relief Mechanics SRS is a voluntary account that helps you save on taxes today while building wealth for tomorrow. Annual Contribution Caps: Up to S$15,300 for Singaporeans/PRs (and S$35,700 for foreigners). Tax Benefit: Every dollar contributed directly reduces your taxable income for that year (e.g., contributing $15,300 to SRS reduces your taxable assessable income for the year by $15,300). Tax-Free Withdrawals at Retirement: 50% of SRS withdrawals are tax-exempt if made on or after the statutory retirement age (age 63, moving to 64 in July 2026 and 65 by 2030). Broader Choice of Investments Unlike CPF-OA, SRS funds can be invested in a wider range of eligible products, such as any ETF listed on SGX, allowing for broader global and sector exposure. e available choices differ from those under CPFIS, so investors should verify whether a particular product is eligible before investing. Examples of ETFS to research include: Regional Technology: Lion-OCBC Securities Hang Seng TECH ETF (HST.SI) Real Estate Income (S-REITs): Lion-Phillip S-REIT ETF (CLR.SI) or NikkoAM-STC Asia REIT ETF (CFA.SI) Global / US Equities: SPDR S&P 500 ETF (S27.SI) 4. Sample Model Portfolios for CPF-OA & SRS The appropriate allocation depends on your retirement horizon, financial circumstances, risk tolerance and existing investments. The following examples illustrate how investors might approach portfolio construction Strategy A: Conservative Growth & Income (CPF-OA Focus) Designed for stability with steady dividend income: 70% Allocation: SPDR STI ETF (ES3.SI) — Captures ~3.5%–4.5% annual dividend yield from Singapore's top banks and companies. 30% Allocation: ABF Singapore Bond Index Fund (A35.SI) — Provides fixed income backed by Singapore Government Securities. Strategy B: Global Growth & Yield (SRS Focus) Designed for long-term wealth growth and income: 50% Allocation: SPDR S&P 500 ETF (S27.SI) — Broad exposure to the top 500 US companies. 30% Allocation: Lion-OCBC Hang Seng TECH ETF (HST.SI) — Targeted growth exposure to major Asian tech leaders. 20% Allocation: Lion-Phillip S-REIT ETF (CLR.SI) — Generates regular dividend payouts from Singapore Real Estate Investment Trusts. 5. Key Considerations & Best Practices Mind the Transaction Fees: Transaction fees, agent bank charges and other applicable costs can affect your net returns, particularly when making smaller investments. For example, CPFIS trades incur agent bank clearing fees ($2 to $2.50 per transaction for CPFIS). Review the full fee schedule and consider how frequently you trade. Investing larger amounts less frequently may reduce the proportion of costs relative to the amount invested, although this should not come at the expense of an appropriate investment strategy. Reinvest Dividend Distributions: Dividends and fund distributions can contribute to long-term portfolio growth. If your objective is to accumulate retirement savings, reinvesting these proceeds may help your investments compound over time. Cash dividends from CPFIS and SRS investments flow back into your agent bank account. Set a calendar reminder to manually reinvest these funds periodically so your wealth keeps compounding. Avoid Early SRS Withdrawals: Withdrawing SRS cash before reaching your statutory retirement age incurs a 5% penalty, and 100% of the withdrawn amount will be taxed as income. Plan your contributions with your expected cash-flow needs in mind, and avoid committing money that you may need access to before retirement. 5. Key Takeaways CPF-OA and SRS serve different purposes, and investing through either scheme involves trade-offs. Beat the Hurdle Rates: CPF-OA provides a base interest rate (2.5% p.a.) and additional interest may apply under CPF rules, while SRS offers potential tax benefits and access to eligible investments. The decision is not simply about seeking the highest possible return. It is about understanding the benefits you may be giving up, the risks you are taking, and how each investment fits into your broader retirement plan. Optimise Taxes & Costs: Utilise SRS for immediate dollar-for-dollar tax deductions and batch your CPFIS trades to keep agent bank fees low. Stay Invested: Automate dividend reinvestments and hold your SRS positions until reaching the statutory retirement age to avoid early withdrawal penalties. As always, before investing, review your financial needs, compare the costs and investment options available, and ensure that your portfolio is appropriate for your circumstances. A well-considered strategy should support your retirement goals without exposing you to risks you cannot afford to take. Disclaimer These commentaries are intended for general circulation and do not have regard to the specific investment objectives, financial situation and particular needs of any person. Accordingly, no warranty whatsoever is given and no liability whatsoever is accepted for any loss arising whether directly or indirectly as a result of any person acting based on this information. You should seek advice from a financial adviser regarding the suitability of any investment product(s) mentioned herein, taking into account your specific investment objectives, financial situation or particular needs, before making a commitment to invest in such products. Opinions expressed in these commentaries are subject to change without notice. Investments are subject to investment risks including the possible loss of the principal amount invested. The value of units in any fund and the income from them may fall as well as rise. Past performance figures as well as any projection or forecast used in these commentaries are not necessarily indicative of future or likely performance. Phillip Securities Pte Ltd (PSPL), its directors, connected persons or employees may from time to time have an interest in the financial instruments mentioned in these commentaries. The information contained in these commentaries has been obtained from public sources which PSPL has no reason to believe are unreliable and any analysis, forecasts, projections, expectations and opinions (collectively the “Research”) contained in these commentaries are based on such information and are expressions of belief only. PSPL has not verified this information and no representation or warranty, express or implied, is made that such information or Research is accurate, complete or verified or should be relied upon as such. Any such information or Research contained in these commentaries are subject to change, and PSPL shall not have any responsibility to maintain the information or Research made available or to supply any corrections, updates or releases in connection therewith. In no event will PSPL be liable for any special, indirect, incidental or consequential damages which may be incurred from the use of the information or Research made available, even if it has been advised of the possibility of such damages. The companies and their employees mentioned in these commentaries cannot be held liable for any errors, inaccuracies and/or omissions howsoever caused. Any opinion or advice herein is made on a general basis and is subject to change without notice. The information provided in these commentaries may contain optimistic statements regarding future events or future financial performance of countries, markets or companies. You must make your own financial assessment of the relevance, accuracy and adequacy of the information provided in these commentaries. Views and any strategies described in these commentaries may not be suitable for all investors. Opinions expressed herein may differ from the opinions expressed by other units of PSPL or its connected persons and associates. Any reference to or discussion of investment products or commodities in these commentaries is purely for illustrative purposes only and must not be construed as a recommendation, an offer or solicitation for the subscription, purchase or sale of the investment products or commodities mentioned. This advertisement has not been reviewed by the Monetary Authority of Singapore.
Lion-Phillip S-REIT ETF: Analysts Maintain Positive Outlook Despite Rate Headwinds
Brief Overview Phillip Securities Research maintains its ACCUMULATE recommendation on Lion-Phillip S-REIT ETF (SREITS) with a reduced target price of S$0.85, down from S$0.90. The ETF has undergone portfolio changes with Keppel DC REIT becoming the top holding, replacing CapitaLand Ascendas REIT, while Mapletree Logistics Trust remains the third-largest position. The fund continues to offer diversified exposure across retail, commercial, industrial and data-centre assets, balancing stable income with growth opportunities. Investment Positives The ETF's strongest advantage lies in its well-diversified portfolio structure across eight property sectors. Industrial assets form the largest allocation at 35.6%, followed by retail at 17.5%, providing investors with broad exposure across Singapore's REIT market while reducing concentration risk in any single sector. The diversified exposure to retail, commercial, industrial, and data-centre assets create a balanced investment proposition that combines stable rental income streams with structural growth opportunities. This diversificiation allows the ETF to benefit from different property cycles and tenant demand patterns across various sectors. Looking ahead, analysts expect organic rental growth to support the ETF's performance. In addition, easing domestic financing costs should provide tailwinds for the underlying REITs, contributing to a gradual recovery in distribution per unit (DPU) through FY27. Challenges The primary concern facing the ETF is uncertainty over the interest-rate outlook, which may limit near-term valuation upside. Interest rate movements typically have an inverse relationship with REIT valuations, and the current uncertain environment creates headwinds for immediate price appreciation. Outlook Despite near-term challenges from interest rate uncertainty, the analysts maintain a constructive medium-term outlook. The combination of organic rental growth and easing domestic financing costs is expected to support a gradual recovery in DPU throughFY27, providing a pathway for improved performance as interest rate concerns subside. Recommendation & Target Price Phillip Securities Research maintains its ACCUMULATE recommendation for Lion-Phillip S-REIT ETF. The analysts have lowered their target price to S$0.85 from the previous S$0.90, derived using a combination of historical dividend yield spread and price-to-book ratio methodologies, with equal weighting applied to both valuation approaches. Frequently Asked Questions [market_journal_faq] This article has been auto-generated using PhillipGPT. It is based on a report by a Phillip Securities Research analyst. Disclaimer These commentaries are intended for general circulation and do not have regard to the specific investment objectives, financial situation and particular needs of any person. Accordingly, no warranty whatsoever is given and no liability whatsoever is accepted for any loss arising whether directly or indirectly as a result of any person acting based on this information. You should seek advice from a financial adviser regarding the suitability of any investment product(s) mentioned herein, taking into account your specific investment objectives, financial situation or particular needs, before making a commitment to invest in such products. Opinions expressed in these commentaries are subject to change without notice. Investments are subject to investment risks including the possible loss of the principal amount invested. The value of units in any fund and the income from them may fall as well as rise. Past performance figures as well as any projection or forecast used in these commentaries are not necessarily indicative of future or likely performance. Phillip Securities Pte Ltd (PSPL), its directors, connected persons or employees may from time to time have an interest in the financial instruments mentioned in these commentaries. The information contained in these commentaries has been obtained from public sources which PSPL has no reason to believe are unreliable and any analysis, forecasts, projections, expectations and opinions (collectively the “Research”) contained in these commentaries are based on such information and are expressions of belief only. PSPL has not verified this information and no representation or warranty, express or implied, is made that such information or Research is accurate, complete or verified or should be relied upon as such. Any such information or Research contained in these commentaries are subject to change, and PSPL shall not have any responsibility to maintain the information or Research made available or to supply any corrections, updates or releases in connection therewith. In no event will PSPL be liable for any special, indirect, incidental or consequential damages which may be incurred from the use of the information or Research made available, even if it has been advised of the possibility of such damages. The companies and their employees mentioned in these commentaries cannot be held liable for any errors, inaccuracies and/or omissions howsoever caused. Any opinion or advice herein is made on a general basis and is subject to change without notice. The information provided in these commentaries may contain optimistic statements regarding future events or future financial performance of countries, markets or companies. You must make your own financial assessment of the relevance, accuracy and adequacy of the information provided in these commentaries. Views and any strategies described in these commentaries may not be suitable for all investors. Opinions expressed herein may differ from the opinions expressed by other units of PSPL or its connected persons and associates. Any reference to or discussion of investment products or commodities in these commentaries is purely for illustrative purposes only and must not be construed as a recommendation, an offer or solicitation for the subscription, purchase or sale of the investment products or commodities mentioned. This advertisement has not been reviewed by the Monetary Authority of Singapore.

Semiconductor Sector Shows Strong Growth Acceleration Led by Custom ASIC Players
Brief Overview The semiconductor sector has demonstrated mixed performance over the past three months, with the Semiconductor ETF rising 2.4% but underperforming the S&P500's 4.1% gain. Equipment players faced headwinds due to elevated valuations, while memory companies declined amid HBM4 shipment uncertainties. However, enterprise and sovereign AI buildout is driving higher demand, with Coreweave and Nebius' combined remaining performance obligations reaching US$141 billion in June 2026. Investment Positives The semiconductor sector presents compelling growth opportunities across multiple segments. Custom ASIC companies are leading the acceleration, with Broadcom and Marvell guiding 3Q26e revenue to surge 89% year-on-year to a combined US$38 billion, surpassing the combined growth guidance of 83% from NVIDIA and AMD. Equipment manufacturers are experiencing robust demand, with their combined 3Q26e revenue guided to reach 52% year-on-year growth to US$31.4 billion, representing potentially the largest growth since 2021. This equipment demand is underpinned by TSMC's increased capital expenditure guidance of US$62 billion, marking a 15% increase, alongside memory players' higher equipment spending as new fabrication facilities ramp up production. The broadening customer base strengthens the sector's resilience. Coreweave and Nebius have expanded their client roster to include major enterprises such as Caterpillar, Grammarly, Databricks, Reflection, AI neolabs and quantitative trading firms. This diversification across AI neoclouds, enterprises and sovereign nations makes NVIDIA and AMD's growth more resilient should hyperscaler capital expenditure moderate. From a valuation perspective, large-cap SaaS companies are trading at roughly -1 standard deviation, with an EV/Sales multiple of 9.5x versus their 3-year average of 10.8x, suggesting attractive valuations despite strong performance. Enterprise and sovereign nations' AI buildout continues to drive substantial demand growth, with Coreweave and Nebius' combined remaining performance obligations increasing 72% from December 2025 to reach US$141 billion by June 2026. Challenges Valuation concerns persist in certain segments of the semiconductor sector. Equipment players AMAT and Lam Research have experienced significant pullbacks, declining 10.6% and 3.7% respectively, as they trade at elevated forward price-to-earnings ratios of 40x and 34x, compared with the sector average of 27x. Memory companies face headwinds from currency fluctuations and product transition uncertainties. SK Hynix declined 17% while Samsung fell 1.9%, laregly due to uncertainty surrounding HBM4 shipment timelines and the impact of a stronger Korean won on their financial performance. Outlook The outlook for the semiconductor sector remains positive, supported by accelerating growth across the custom ASIC, equipment and foundry segments. Revenue growth acceleration is expected in 3Q26e across these key areas, with custom ASIC companies leading the charge. The diversification of AI demand across multiple customer segments provides additional stability to the growth trajectory. Recommendation & Target Price Phillip Securities Research maintains an OVERWEIGHT recommendation on the semiconductor sector, reflecting confidence in the strong growth momentum of custom ASIC companies, equipment manufacturers and foundry operations. Frequently Asked Questions [market_journal_faq] This article has been auto-generated using PhillipGPT. It is based on a report by a Phillip Securities Research analyst. Disclaimer These commentaries are intended for general circulation and do not have regard to the specific investment objectives, financial situation and particular needs of any person. Accordingly, no warranty whatsoever is given and no liability whatsoever is accepted for any loss arising whether directly or indirectly as a result of any person acting based on this information. You should seek advice from a financial adviser regarding the suitability of any investment product(s) mentioned herein, taking into account your specific investment objectives, financial situation or particular needs, before making a commitment to invest in such products. Opinions expressed in these commentaries are subject to change without notice. Investments are subject to investment risks including the possible loss of the principal amount invested. The value of units in any fund and the income from them may fall as well as rise. Past performance figures as well as any projection or forecast used in these commentaries are not necessarily indicative of future or likely performance. Phillip Securities Pte Ltd (PSPL), its directors, connected persons or employees may from time to time have an interest in the financial instruments mentioned in these commentaries. The information contained in these commentaries has been obtained from public sources which PSPL has no reason to believe are unreliable and any analysis, forecasts, projections, expectations and opinions (collectively the “Research”) contained in these commentaries are based on such information and are expressions of belief only. PSPL has not verified this information and no representation or warranty, express or implied, is made that such information or Research is accurate, complete or verified or should be relied upon as such. Any such information or Research contained in these commentaries are subject to change, and PSPL shall not have any responsibility to maintain the information or Research made available or to supply any corrections, updates or releases in connection therewith. In no event will PSPL be liable for any special, indirect, incidental or consequential damages which may be incurred from the use of the information or Research made available, even if it has been advised of the possibility of such damages. The companies and their employees mentioned in these commentaries cannot be held liable for any errors, inaccuracies and/or omissions howsoever caused. Any opinion or advice herein is made on a general basis and is subject to change without notice. The information provided in these commentaries may contain optimistic statements regarding future events or future financial performance of countries, markets or companies. You must make your own financial assessment of the relevance, accuracy and adequacy of the information provided in these commentaries. Views and any strategies described in these commentaries may not be suitable for all investors. Opinions expressed herein may differ from the opinions expressed by other units of PSPL or its connected persons and associates. Any reference to or discussion of investment products or commodities in these commentaries is purely for illustrative purposes only and must not be construed as a recommendation, an offer or solicitation for the subscription, purchase or sale of the investment products or commodities mentioned. This advertisement has not been reviewed by the Monetary Authority of Singapore.

Software Sector Stages Strong Recovery as AI Concerns Subside
Brief Overview The software industry has experienced a significant re-rating, with the iShares Software ETF (IGV) rebounding 17% in 3Q26 and now sitting just 7% below its September 2025 peak. SaaS LTM revenue growth accelerated to 17.5% YoY in 2Q26, marking the strongest growth in 15 quarters. Phillip Securities Research maintains an OVERWEIGHT stance on software, favouring SaaS infrastructure, data analytics, and cybersecurity as key AI beneficiaries. Investment Positives The software sector's recovery has been driven by easing concerns over AI disruption, with market leader Microsoft surging 30% following its 4Q26 results. Microsoft's performance was supported by Azure growth exceeding 40% YoY, no unexpected incremental capital expenditure announcements despite peers raising spending, and the introduction of usage-based billing. The rebound has also extended to data and AI platform companies, with Palantir gaining 61% and Snowflake rising 35% during the quarter. Salesforce also advanced following the launch of Claudeforce, its joint application with Anthropic, reinforcing the value of proprietary enterprise data despite increasingly capable AI models. Large-cap SaaS companies continue to outperform, benefiting from AI-tier upgrades, usage-based pricing, and seat expansion. These companies are enjoying higher sales growth of 18.2%, which is 0.7 percentage points higher year-on-year, as enterprises spend more on higher-priced AI tiers, increase adoption of usage-based pricing, and expand seat usage. Excluding Microsoft and Oracle, growth remained healthy at 16.3%. From a valuation perspective, large-cap SaaS companies are trading at roughly -1 standard deviation, with an EV/Sales multiple of 9.5x versus their 3-year average of 10.8x, suggesting attractive valuations despite strong performance. Challenges Cybersecurity valuations remain elevated, with companies trading at stretched multiples. This has led to concerns about sustainability of current price levels in this subsector, despite its strong year-to-date performance. Outlook The software sector appears to be emerging from what the research describes as the "SaaSpocalypse", with growth rates expected to persist in 3Q26e. The preferred investment areas include SaaS infrastructure, data analytics, and cybersecurity as key AI beneficiaries. Top picks are supported by strong AI adoption, expanding backlog conversion, and rising enterprise data demand. Recommendation & Target Price Phillip Securities Research maintains an OVERWEIGHT recommendation on the software sector. Preferred names include Microsoft, Oracle, Palantir, and Snowflake. However, the firm has downgraded Palo Alto Networks to NEUTRAL, as its valuation appears stretched, trading at 97x P/E versus its 5-year average of 54x. Frequently Asked Questions [market_journal_faq] This article has been auto-generated using PhillipGPT. It is based on a report by a Phillip Securities Research analyst. Disclaimer These commentaries are intended for general circulation and do not have regard to the specific investment objectives, financial situation and particular needs of any person. Accordingly, no warranty whatsoever is given and no liability whatsoever is accepted for any loss arising whether directly or indirectly as a result of any person acting based on this information. You should seek advice from a financial adviser regarding the suitability of any investment product(s) mentioned herein, taking into account your specific investment objectives, financial situation or particular needs, before making a commitment to invest in such products. Opinions expressed in these commentaries are subject to change without notice. Investments are subject to investment risks including the possible loss of the principal amount invested. The value of units in any fund and the income from them may fall as well as rise. Past performance figures as well as any projection or forecast used in these commentaries are not necessarily indicative of future or likely performance. Phillip Securities Pte Ltd (PSPL), its directors, connected persons or employees may from time to time have an interest in the financial instruments mentioned in these commentaries. The information contained in these commentaries has been obtained from public sources which PSPL has no reason to believe are unreliable and any analysis, forecasts, projections, expectations and opinions (collectively the “Research”) contained in these commentaries are based on such information and are expressions of belief only. PSPL has not verified this information and no representation or warranty, express or implied, is made that such information or Research is accurate, complete or verified or should be relied upon as such. Any such information or Research contained in these commentaries are subject to change, and PSPL shall not have any responsibility to maintain the information or Research made available or to supply any corrections, updates or releases in connection therewith. In no event will PSPL be liable for any special, indirect, incidental or consequential damages which may be incurred from the use of the information or Research made available, even if it has been advised of the possibility of such damages. The companies and their employees mentioned in these commentaries cannot be held liable for any errors, inaccuracies and/or omissions howsoever caused. Any opinion or advice herein is made on a general basis and is subject to change without notice. The information provided in these commentaries may contain optimistic statements regarding future events or future financial performance of countries, markets or companies. You must make your own financial assessment of the relevance, accuracy and adequacy of the information provided in these commentaries. Views and any strategies described in these commentaries may not be suitable for all investors. Opinions expressed herein may differ from the opinions expressed by other units of PSPL or its connected persons and associates. Any reference to or discussion of investment products or commodities in these commentaries is purely for illustrative purposes only and must not be construed as a recommendation, an offer or solicitation for the subscription, purchase or sale of the investment products or commodities mentioned. This advertisement has not been reviewed by the Monetary Authority of Singapore.