Sharpe ratio
Table of Contents
Sharpe ratio
Investing is a field fraught with danger and opportunity. Investors and analysts use a variety of methods in this complicated environment to assess the viability of various investment possibilities. The sharpe ratio is one of these instruments that stands out because it provides a quantitative evaluation of the return on an investment in proportion to its risk. Here, we look at its fundamentals, methodology, importance, and inherent constraints.
What is sharpe ratio?
The sharpe ratio, christened after its creator, Nobel laureate William F. Sharpe, is a financial metric that provides investors with a numerical measure of an investment’s risk-adjusted return. In essence, it quantifies whether an investment’s potential return compensates for the inherent risk it entails. This ratio is particularly invaluable in situations where different investment opportunities possess distinct levels of risk.
The sharpe ratio is fundamentally a barometer of investing caution, a reliable indicator of whether the profit an investment offers is worth the risk it involves. Through this ratio, the proverb “higher the risk, higher the reward” finds an appropriate translation. The sharpe ratio is the prelude of balance rather than just serving as a herald of absolutes.
The intellect of William F. Sharpe, who saw that investments, like two-edged swords, including both the possibility of gain and the spectre of loss, gave rise to this financial lodestar. The responsibility of measuring this complex balance falls to the sharpe ratio. It gives investors a clear picture of an investment’s past performance so they can assess its historical return to risk.
Understanding the sharpe ratio
The duality of risk and reward forms the basis for comprehending the sharpe ratio. Although a larger return is preferred, it must be carefully compared to the risk taken to get that return. The sharpe ratio captures this delicate balance by determining if the return on an investment is reasonable compared to its risk.
Analysing the sharpe ratio’s constituent parts and ramifications is crucial to understanding its importance. This ratio, at its heart, captures the interaction between risk and return, a basic tenet of finance. Risk in the context of investments refers to the possibility that the actual returns on an investment may differ from those anticipated. On the other hand, reward refers to the returns a shareholder anticipates.
The sharpe ratio steps into this narrative by acting as an arbitrator between these two realms. It seeks to answer a pivotal question: Does the potential extra return of an investment adequately compensate for the additional risk it entails? In this pursuit, the ratio ushers in the concept of risk-adjusted return, a paramount concept that aligns more intuitively with investors’ concerns.
Imagine two investments, each boasting the same average return. However, upon closer inspection, one investment exhibits higher volatility, causing its returns to oscillate wildly. The sharpe ratio discerns this difference and translates it into a numerical language. It acknowledges that investors don’t just chase high returns; they chase returns that come with a level of predictability and stability.
Consequently, the sharpe ratio unveils a layer of sophistication in investment evaluation. It imparts a numerical weight to the intuitive understanding that investments with less risk relative to their return are often more enticing. By quantifying this relationship, it arms investors with a discerning lens to analyse investment prospects more comprehensively.
Formula for the sharpe ratio
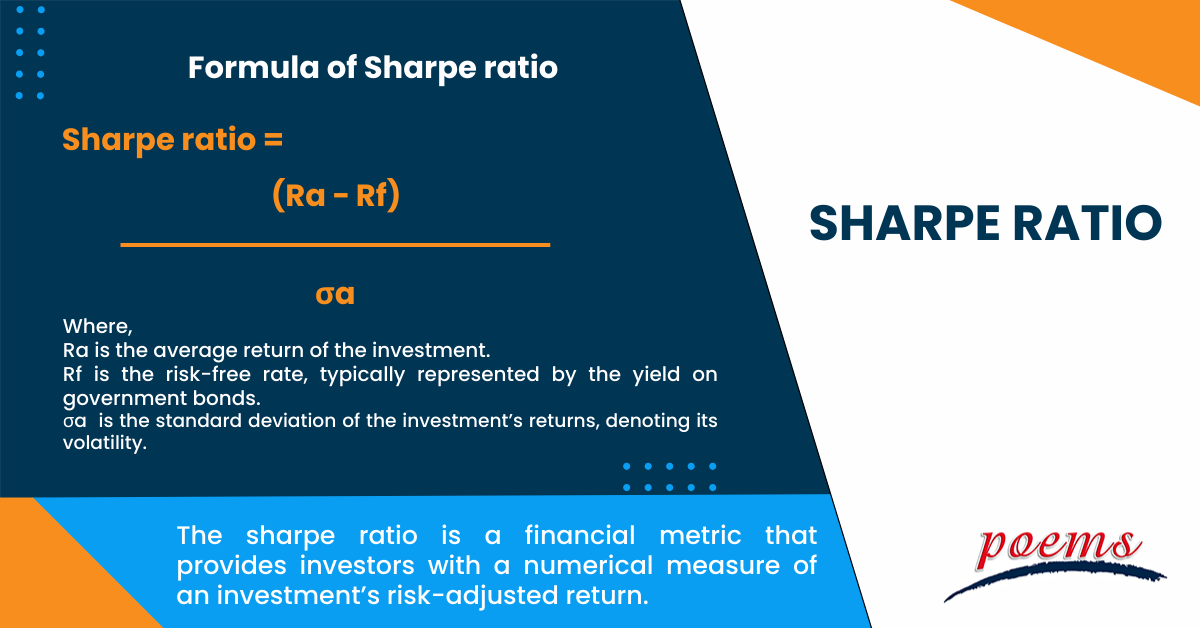
The mathematical formulation of the sharpe ratio is elegant. It is the difference between the average return of the investment and the risk-free rate, divided by the used methods mathematically:
Sharpe ratio = (Ra − Rf) / σa
Where,
Ra is the average return of the investment.
Rf is the risk-free rate, typically represented by the yield on government bonds.
σa is the standard deviation of the investment’s returns, denoting its volatility.
Calculation of sharpe ratio
Let us suppose an investment has an average return of 10%, the risk-free rate is 2%, and its standard deviation is 15%. The sharpe ratio for this investment would be calculated as follows:
Sharpe ratio = 0.10 − 0.020.15
= 0.53
Importance of the sharpe ratio
The sharpe ratio provides a comprehensive metric to compare and contrast the risk-adjusted returns of different investment opportunities. By standardising the evaluation process, it aids investors in making informed decisions by considering both the potential return and the risk associated with an investment.
Frequently Asked Questions
Take into account Option A, which offers an average return of 8%, and Option B, which offers an average return of 12%. The sharpe ratios for Option A and Option B would be 0.50 and 0.90, respectively, if the risk-free rate is 3% and the standard deviations for both options are 10%. This suggests that Option B has a larger return after adjusting for risk.
A higher sharpe ratio generally indicates a better risk-adjusted return. However, the interpretation of what is considered “good” is based on the risk of the investor. As a rule of thumb, a sharpe ratio above 1 is often deemed satisfactory.
Collect historical return information for the investment, establish the risk-free rate, then compute the investment’s standard deviation to calculate the sharpe ratio. Apply the above given sharpe ratio formula after that.
The sharpe ratio is a popular financial tool for calculating the risk-adjusted return on an investment or portfolio. Its benefits include offering a single, simple statistic that allows investors to gauge the success of an investment. It considers both profits and risk, allowing for comparisons of investments with varying levels of risk. Sharpe Ratios with higher values suggest greater risk-adjusted returns, which aids decision-making. Furthermore, it encourages investors to think about risk and reward, advocating a more balanced approach to portfolio management. Due to its simplicity and emphasis on risk-adjusted returns, this measure is a great tool for optimising investment portfolios.
- Dependency on Historical Data: The sharpe ratio hinges on historical data, assuming that the future will mimic the past. This assumption can falter during times of market upheaval.
- Neglects Non-Normal Distributions: The ratio presupposes a normal distribution of returns, which may not hold true for all investments.
- Ignores Investment Horizon: The sharpe ratio fails to consider the time horizon of investments, potentially misleading long-term investors.
Related Terms
- Adjusted distributed income
- International securities exchanges
- Margin Requirement
- Pledged Asset
- Stochastic Oscillator
- Prepayment risk
- Homemade leverage
- Prime bank investments
- ESG
- Capitulation
- Shareholder service fees
- Insurable Interest
- Minority Interest
- Passive Investing
- Market cycle
- Progressive tax
- Correlation
- NFT
- Carbon credits
- Hyperinflation
- Hostile takeover
- Travel insurance
- Money market
- Dividend investing
- Digital Assets
- Coupon yield
- Counterparty
- Alpha and beta
- Investment advisory
- Wealth management
- Variable annuity
- Asset management
- Value of Land
- Investment Policy
- Investment Horizon
- Forward Contracts
- Equity Hedging
- Encumbrance
- Money Market Instruments
- Share Market
- Opening price
- Transfer of Shares
- Alternative investments
- Lumpsum
- Derivatives market
- Operating assets
- Hypothecation
- Accumulated dividend
- Assets under management
- Endowment
- Return on investment
- Investments
- Acceleration clause
- Heat maps
- Lock-in period
- Tranches
- Stock Keeping Unit
- Real Estate Investment Trusts
- Prospectus
- Turnover
- Tangible assets
- Preference Shares
- Open-ended investment company
- Standard deviation
- Independent financial adviser
- ESG investing
- Earnest Money
- Primary market
- Leveraged Loan
- Transferring assets
- Shares
- Fixed annuity
- Underlying asset
- Quick asset
- Portfolio
- Mutual fund
- Xenocurrency
- Bitcoin Mining
- Option contract
- Depreciation
- Inflation
- Cryptocurrency
- Options
- Asset
- Reinvestment option
- Capital appreciation
- Style Box
- Top-down Investing
- Trail commission
- Unit holder
- Yield curve
- Rebalancing
- Vesting
- Private equity
- Bull Market
- Absolute Return
- Leaseback
- Impact investing
- Venture Capital
- Buy limit
- Asset stripper
- Volatility
- Investment objective
- Annuity
- Sustainable investing
- Face-amount certificate
- Lipper ratings
- Investment stewardship
- Average accounting return
- Asset class
- Active management
- Breakpoint
- Expense ratio
- Bear market
- Annualised rate of return
- Hedging
- Equity options
- Dollar-Cost Averaging (DCA)
- Due Diligence
- Contrarian Investor
Most Popular Terms
Other Terms
- Settlement currency
- Federal funds rate
- Active Tranche
- Convertible Securities
- Synthetic ETF
- Physical ETF
- Initial Public Offering
- Buyback
- Secondary Sharing
- Bookrunner
- Notional amount
- Negative convexity
- Jumbo pools
- Inverse floater
- Forward Swap
- Underwriting risk
- Reinvestment risk
- Final Maturity Date
- Payment Date
- Secondary Market
- Mark-to-market
- Yield Pickup
- Subordinated Debt
- Trailing Stops
- Treasury Stock Method
- Bullet Bonds
- Basket Trade
- Contrarian Strategy
- Exchange Control
- Notional Value
- Relevant Cost
- Dow Theory
- Speculation
- Stub
- Trading Volume
- Going Long
- Pink sheet stocks
- Rand cost averaging
- Sustainable investment
- Stop-limit sell order
- Economic Bubble
- Ask Price
- Constant prepayment rate
- Covenants
- Stock symbol
- Companion tranche
- Synthetic replication
- Bourse
- Beneficiary
- Witching Hour
Know More about
Tools/Educational Resources
Markets Offered by POEMS
Read the Latest Market Journal

Navigating the vast world of unit trusts can be daunting. With nearly 2000 funds available...

Predicting Trend Reversals with Candlestick Patterns for Beginners
Candlestick patterns are used to predict the future direction of price movements as they contain...

In the diverse and complex world of investing, unit trusts stand out as a popular...

Back in Business: The Return of IPOs & Top Traded Counters in March 2024
Start trading on POEMS! Open a free account here! At a glance: Major indices continue...
Weekly Updates 15/4/24 – 19/4/24
This weekly update is designed to help you stay informed and relate economic and company...
From $50 to $100: Unveiling the Impact of Inflation
In recent years, inflation has become a hot topic, evoking strong emotions as the cost...

Japan’s Economic Resurgence: Unveiling the Tailwinds Behind Nikkei 225’s Record Leap
Source: eSignal, Intercontinental Exchange, Inc. In the heart of Japan’s economic landscape, the Nikkei 225...
Weekly Updates 8/4/24 – 12/4/24
This weekly update is designed to help you stay informed and relate economic and...


