Yield curve
Table of Contents
- Yield curve
- What is a yield curve?
- Understanding the yield curve
- How does the yield curve work?
- Types of yield curves
- Importance of yield curves
- How can investors use the yield curve?
- What is yield curve risk?
- What are yield curve theories?
- What is the relationship between the price of a bond and its yield?
- What is the difference between interest rates and bond yields?
Yield curve
Investments and debt are not created equally. They have various maturities and interest rates. The concept of yield curves is crucial to understanding them if you have invested outside your business or borrowed money. A yield curve can help you better understand the overall economy in which your company works and demonstrate how hard your investment is working for you.
Understanding yield curves is essential for comprehending how various interest rates operate and change over time. This is something that will be useful to your business and financial well-being. And they can aid in understanding an investment’s risk, possible returns, and even broader economic results.
What is a yield curve?
The interest rates on debt for different maturities are represented graphically by the yield curve. It shows the anticipated rate of return on an investor’s investment for a given time frame.
A bond’s yield is displayed on the graph’s vertical axis, while its remaining maturity time is displayed across the graph’s horizontal axis. Although the curve is normally upward-sloping, it may take on different shapes during different economic cycles.
Since long-term returns are lower than short-term returns, the yield curve can serve as a leading economic indicator, particularly when it flips to an inverted shape, which denotes an economic slump.
Understanding the yield curve
Understanding yield curves can help you and your organization in various ways. You can time a business or personal borrowing to coincide with favorably low rates by using it to assist you in forecasting interest rates.
Financial intermediaries may find it useful in understanding and anticipating their profits. Additionally, it can provide a more comprehensive view of the market and assist you in avoiding overpriced stocks that are less likely to increase the value of your investment portfolio.
How does the yield curve work?
A yield curve can easily show the bond market at a certain time. The average yields on bonds with short, medium, or long maturities from a certain trading day or week are often shown.
A yield curve uses a graph to show how much interest is paid on debt. Seeing each bond’s risk and potential return is a fantastic method. The vertical axis represents the bond’s yield or interest rate (expressed as a percentage), and the horizontal axis represents the term to maturity. The yield curve concept is most frequently used when looking at national treasury securities. It can be compared to another person, company, and mortgage lending rates.
Types of yield curves
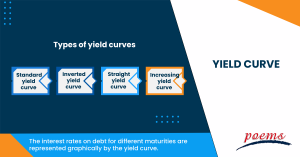
The types of yield curves are as follows:
- Standard yield curve
A typical yield curve slopes to the right as yields increase with maturity. This suggests that the market environment and the economy are sound and operating normally.
- Inverted yield curve
The yield curve is inverted when rates for shorter-term maturities are greater than those for longer-term maturities. The yield curve, in this instance, slopes rightward and downward instead of upward. This is a sign of a bear market or recession when bond prices and yields experience significant drops.
- Straight yield curve
A flat yield curve results when the yields for shorter- and longer-term maturities are almost equal. Mid-term maturities usually have a higher product than short-term or long-term maturities in the elevated zone in the middle of flat yield curves. The yield curve indicates this with a hump.
- Increasing yield curve
A steep yield curve has a steeper slope than a normal yield curve. The market environment is the same for steep and typical yield curves. But when the curve gets more vertical, the gap between short- and long-term rates grows, suggesting that investors believe that more favorable market circumstances will last longer.
Importance of yield curves
The importance of yield curves is as follows:
- Making interest rate predictions
Investors can understand the expected future trajectory of interest rates based on the curve’s form. In contrast to an inverted curve, which indicates short-term assets have a higher yield, a regular upward-sloping curve means long-term securities have a higher yield.
- The maturity and yield trade-off
The yield curve demonstrates the trade-off between yield and maturity. If the yield curve is upward sloping, the investor will have to take on greater risk by investing in longer-term securities to raise his yield.
- Securities that are overpriced or underpriced.
Investors can use the curve to determine if a security is now overpriced or underpriced. A security is underpriced or overpriced depending on where its rate of return falls on the yield curve. If it is above the yield curve, the deposit is underpriced.
- Benefits for financial intermediaries
The majority of the money that banks and other financial intermediaries use to lend is borrowed through selling short-term deposits. The greater the difference between lending and borrowing rates and the steeper the upward-sloping slope, the greater their profit. On the other hand, a flat or downward-sloping curve often indicates a decline in the earnings of financial intermediaries.
How can investors use the yield curve?
Investors can understand the expected future trajectory of interest rates based on the curve’s form. In contrast to an inverted curve, which indicates short-term assets have a higher yield, a regular upward-sloping curve means long-term securities have a higher yield.
What is yield curve risk?
The risk of an unfavorable change in market interest rates that comes with investing in fixed-income instruments is known as the yield curve risk. A change in market yields will affect a fixed-income instrument’s pricing.
What are yield curve theories?
According to the Yield Curve theory, a long-term bond’s interest rate will equal the average of the short-term interest rates anticipated to be in effect during the bond’s lifetime plus a term premium. Due to their risk aversion and distaste for the possibility of significant capital losses on long-term debt, investors want such a premium.
What is the relationship between the price of a bond and its yield?
Bond prices and yields have a significant but opposing link. Bond yields are higher than coupon rates when the bond price is less than the bond’s face value. Bond yields are lower than coupon rates when the bond price exceeds the bond’s face value.
What is the difference between interest rates and bond yields?
While a bond’s interest rates are determined based on the asset’s face value, bond yield is determined based on the value of your investment (which is the amount of money promised to a bondholder when the bond matures).
Related Terms
- Adjusted distributed income
- International securities exchanges
- Margin Requirement
- Pledged Asset
- Stochastic Oscillator
- Prepayment risk
- Homemade leverage
- Prime bank investments
- ESG
- Capitulation
- Shareholder service fees
- Insurable Interest
- Minority Interest
- Passive Investing
- Market cycle
- Progressive tax
- Correlation
- NFT
- Carbon credits
- Hyperinflation
- Hostile takeover
- Travel insurance
- Money market
- Dividend investing
- Digital Assets
- Coupon yield
- Counterparty
- Sharpe ratio
- Alpha and beta
- Investment advisory
- Wealth management
- Variable annuity
- Asset management
- Value of Land
- Investment Policy
- Investment Horizon
- Forward Contracts
- Equity Hedging
- Encumbrance
- Money Market Instruments
- Share Market
- Opening price
- Transfer of Shares
- Alternative investments
- Lumpsum
- Derivatives market
- Operating assets
- Hypothecation
- Accumulated dividend
- Assets under management
- Endowment
- Return on investment
- Investments
- Acceleration clause
- Heat maps
- Lock-in period
- Tranches
- Stock Keeping Unit
- Real Estate Investment Trusts
- Prospectus
- Turnover
- Tangible assets
- Preference Shares
- Open-ended investment company
- Standard deviation
- Independent financial adviser
- ESG investing
- Earnest Money
- Primary market
- Leveraged Loan
- Transferring assets
- Shares
- Fixed annuity
- Underlying asset
- Quick asset
- Portfolio
- Mutual fund
- Xenocurrency
- Bitcoin Mining
- Option contract
- Depreciation
- Inflation
- Cryptocurrency
- Options
- Asset
- Reinvestment option
- Capital appreciation
- Style Box
- Top-down Investing
- Trail commission
- Unit holder
- Rebalancing
- Vesting
- Private equity
- Bull Market
- Absolute Return
- Leaseback
- Impact investing
- Venture Capital
- Buy limit
- Asset stripper
- Volatility
- Investment objective
- Annuity
- Sustainable investing
- Face-amount certificate
- Lipper ratings
- Investment stewardship
- Average accounting return
- Asset class
- Active management
- Breakpoint
- Expense ratio
- Bear market
- Annualised rate of return
- Hedging
- Equity options
- Dollar-Cost Averaging (DCA)
- Due Diligence
- Contrarian Investor
Most Popular Terms
Other Terms
- Options expiry
- Settlement currency
- Federal funds rate
- Active Tranche
- Convertible Securities
- Synthetic ETF
- Physical ETF
- Initial Public Offering
- Buyback
- Secondary Sharing
- Bookrunner
- Notional amount
- Negative convexity
- Jumbo pools
- Inverse floater
- Forward Swap
- Underwriting risk
- Reinvestment risk
- Final Maturity Date
- Payment Date
- Secondary Market
- Mark-to-market
- Yield Pickup
- Subordinated Debt
- Trailing Stops
- Treasury Stock Method
- Bullet Bonds
- Basket Trade
- Contrarian Strategy
- Exchange Control
- Notional Value
- Relevant Cost
- Dow Theory
- Speculation
- Stub
- Trading Volume
- Going Long
- Pink sheet stocks
- Rand cost averaging
- Sustainable investment
- Stop-limit sell order
- Economic Bubble
- Ask Price
- Constant prepayment rate
- Covenants
- Stock symbol
- Companion tranche
- Synthetic replication
- Bourse
- Beneficiary
Know More about
Tools/Educational Resources
Markets Offered by POEMS
Read the Latest Market Journal

Navigating the vast world of unit trusts can be daunting. With nearly 2000 funds available...
Predicting Trend Reversals with Candlestick Patterns for Beginners
Candlestick patterns are used to predict the future direction of price movements as they contain...

In the diverse and complex world of investing, unit trusts stand out as a popular...

Back in Business: The Return of IPOs & Top Traded Counters in March 2024
Start trading on POEMS! Open a free account here! At a glance: Major indices continue...
Weekly Updates 15/4/24 – 19/4/24
This weekly update is designed to help you stay informed and relate economic and company...

From $50 to $100: Unveiling the Impact of Inflation
In recent years, inflation has become a hot topic, evoking strong emotions as the cost...

Japan’s Economic Resurgence: Unveiling the Tailwinds Behind Nikkei 225’s Record Leap
Source: eSignal, Intercontinental Exchange, Inc. In the heart of Japan’s economic landscape, the Nikkei 225...
Weekly Updates 8/4/24 – 12/4/24
This weekly update is designed to help you stay informed and relate economic and...


