
Cryptocurrency
Table of Contents
Cryptocurrency
Cryptocurrencies are a new and exciting technology with the potential to change the financial system as we know it. Nevertheless, there remains a lot of uncertainty regarding how they will be utilised in the future.
What is cryptocurrency?
A digital or virtual money that employs cryptography for security is called cryptocurrency. The term “crypto” refers to the numerous cryptographic methods that protect these entries, such as hashing, public-private key pairings, and elliptical curve encryption.
Since cryptocurrencies are decentralised, As such neither a government nor a financial institution can control them. The earliest and best-known cryptocurrency, Bitcoin, was developed in 2009. On decentralised exchanges, cryptocurrency is often exchanged and may be used to make purchases of products and services.
Understanding cryptocurrency
Cryptocurrencies are powered by blockchain technology. Cryptocurrencies are powered by blockchain technology. Blockchain is a digital ledger of all of the cryptocurrency transactions. Blockchain technology is used to secure and track transactions. Bitcoin, for example, uses a blockchain to track and verify all transactions on the Bitcoin network.
Popular cryptocurrencies include litecoin, bitcoin, monero and ether. Cryptographic methods, which are maintained and verified through a process called mining, a network of computers or specialised hardware, such as application-specific integrated circuits (ASICs), process and validate the transactions, and cryptocurrencies are generated (and secured). The procedure rewards the miners who power the Bitcoin network.
Cryptocurrency assets are often volatile, meaning their prices can fluctuate dramatically. This volatility can make cryptocurrencies a risky investment. However, some believe the volatility will decrease as the market matures.
Types of cryptocurrency
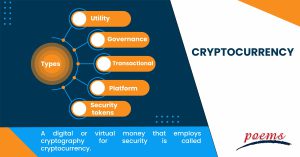
Knowing the different kinds of cryptocurrencies is important, as so many are available nowadays. Knowing if the coin you’re considering serves a purpose will help you evaluate whether investing in it is worthwhile; a cryptocurrency without a use case is riskier than one with one.
Typically, the coin’s name is included while discussing different cryptocurrency varieties. But coin kinds and coin names are different. The following are some of the categories of tokens you could encounter, along with their names:
- Utility
Tokens with this feature include XRP and ETH. On their blockchains, they perform certain roles.
- Governance
These tokens on a blockchain like Uniswap reflect voting or other privileges.
- Transactional
Tokens made to be used as a form of payment. Of these, Bitcoin is the most well-known.
- Platform
These tokens serve programs designed to work with a blockchain like Solana.
- Security tokens
Tokens that reflect ownership of an asset, such as a tokenized stock, are known as security tokens (value transferred to the blockchain). A securitized token is the MS Token, for instance. The Millennium Sapphire may be partially acquired if you can locate one for sale.
Cryptocurrency – how it is produced
Blockchain, a decentralised public ledger updated and maintained by currency holders, is the technology that underlies cryptocurrencies.
The process of “mining,” employing computers’ power to solve challenging mathematical problems to produce coins, is how cryptocurrency units are produced. Additionally, users may purchase the currency from brokers, keep them in encrypted wallets, and then use them to make purchases.
Cryptocurrency ownership entails the lack of any material possessions. What you hold is a key that permits you to move information or a unit of measurement from one person to another without the aid of a trustworthy third party.
Examples cryptocurrency
Examples of cryptocurrencies include:
- Bitcoin
Bitcoin, the first and most prominent cryptocurrency, was created in 2009. The currency’s creator is commonly thought to be Satoshi Nakamoto, an alias for a person or team whose exact identity is still unknown.
- Ethereum
Ethereum, another popular cryptocurrency, was created in 2015. Ethereum differs from Bitcoin in that it allows for smart contracts or contracts that can be executed automatically according to certain conditions.
- Litecoin
Litecoin, another popular cryptocurrency, was created in 2011. In many aspects, Litecoin and Bitcoin are similar, but it is designed to be faster and cheaper to transact.
- Bitcoin cash
It is a fork of Bitcoin, created in 2017. Bitcoin Cash is similar to Bitcoin but has a larger block size, meaning it can process more transactions per second.
Risk Disclosure Statement
The Customer should undertake transactions in futures/ options only when understanding the nature of the contracts (and contractual relationships) into which the Customer is entering and the extent of own exposure to the risks. Trading in futures/ options may not be suitable for everyone. The Customer should carefully consider whether such trading is appropriate for you in the light of your experience, objectives, financial resources and other relevant circumstances. In considering whether to trade, the Customer should be aware of the following, in addition to the risk factors disclosed above:
(14a) Futures, OTCD currency contracts and Spot LFX trading contracts
(i) Effect of ‘Leverage’ or ‘Gearing’
Transactions in futures, OTCD currency contracts and Spot LFX trading contracts carry a high degree of risk. The amount of initial margin is small relative to the value of the futures contract, OTCD currency contract or Spot LFX trading contract transaction so that the transaction is highly ‘leveraged’ or ‘geared’. A relatively small market movement will have a proportionately larger impact on the funds deposited or will have to deposit by the Customer; this may work against or for the Customer. The Customer may sustain a total loss of the initial margin funds and any additional funds deposited with the firm to maintain the position. If the market moves against the position or margin levels are increased, the Customer may be called upon to pay substantial additional funds on short notice in order to maintain the position. If the Customer fail to comply with a request for additional funds within the specified time, the position may be liquidated at a loss and the Customer will be liable for any resulting deficit in the account.
(ii) Risk-Reducing Orders or Strategies
The placing of certain orders (e.g. ‘stop-loss’ orders, where permitted under local law, or ‘stop-limit’ orders) which are intended to limit losses to certain amounts may not be effective because market conditions may make it impossible to execute such orders. At times, it is also difficult or impossible to liquidate a position without incurring substantial losses. Strategies using combinations of positions, such as ‘spread’ and ‘straddle’ positions may be as risky as taking simple ‘long’ or ‘short’ positions.
(14b) Options
(i) Variable Degree of Risk
Transactions in options carry a high degree of risk. Purchasers and sellers of options should familiarise themselves with the type of options (i.e. put or call) which the Customer contemplate trading and the associated risks. The Customer should calculate the extent to which the value of the options would have to increase for the position to become profitable, taking into account the premium paid and all transaction costs.
The purchaser of options may offset its position by trading in the market or exercise the options or allow the options to expire. The exercise of an option results either in a cash settlement or in the purchaser acquiring or delivering the underlying interest. If the option is on a futures contract, OTCD currency contract or Spot LFX trading contract, the purchaser will have to acquire a position in the futures contract, OTCD currency contract or Spot LFX trading contract, as the case may be, with associated liabilities for margin (see the section on Futures, OTCD currency contracts and Spot LFX trading contracts above). If the purchased options expire worthless, the Customer will suffer a total loss of the investment which will consist of the option premium paid plus transaction costs. If the Customer is contemplating purchasing deep-out-of-the-money options, the Customer should be aware that, ordinarily, the chance of such options becoming profitable is remote.
Selling (‘writing’ or ‘granting’) an option generally entails considerably greater risk than purchasing options. Although the premium received by the seller is fixed, the seller may sustain a loss well in excess of the amount of premium received. The seller will be liable to deposit additional margin to maintain the position if the market moves unfavourably. The seller will also be exposed to the risk of the purchaser exercising the option and the seller will be obligated to either settle the option in cash or to acquire or deliver the underlying interest. If the option is on a futures contract, OTCD currency contract or spot LFX trading contract, the seller will acquire a position in the futures contract, OTCD currency contract or spot LFX trading contract, as the case may be, with associated liabilities for margin (see the section on Futures, OTCD currency contracts and Spot LFX trading contracts above). If the option is ‘covered’ by the seller holding a corresponding position in the underlying futures contract, OTCD currency contract, spot LFX trading contract or another option, the risk may be reduced. If the option is not covered, the risk of loss can be unlimited.
Certain exchanges in some jurisdictions permit deferred payment of the option premium, limiting the liability of the purchaser to margin payments not exceeding the amount of the premium. The purchaser is still subject to the risk of losing the premium and transaction costs. When the option is exercised or expires, the purchaser is responsible for any unpaid premium outstanding at that time.
(14c) Additional Risks Common to Futures, Options and Leveraged Foreign Exchange Trading
(i) Terms and Conditions of Contracts
The Customer should ask for the terms and conditions of the specific futures contract, option, OTCD currency contract or spot LFX trading contract which the Customer is trading and the associated obligations (e.g. the circumstances under which the Customer may become obligated to make or take delivery of the underlying interest of a futures contract, OTCD currency contract or spot LFX trading contract transaction and, in respect of options, expiration dates and restrictions on the time for exercise). Under certain circumstances, the specifications of outstanding contracts (including the exercise price of an option) may be modified by the exchange or clearing house to reflect changes in the underlying interest.
(ii) Suspension or Restriction of Trading and Pricing Relationships
Market conditions (e.g. illiquidity) or the operation of the rules of certain markets (e.g. the suspension of trading in any contract or contract month because of price limits or ‘circuit breakers’) may increase the risk of loss by making it difficult or impossible to effect transactions or liquidate/offset positions. If the Customer have sold options, this may increase the risk of loss. Further, normal pricing relationships between the underlying interest and the futures contract, and the underlying interest and the option may not exist. This can occur when, e.g., the futures contract underlying the option is subject to price limits while the option is not. The absence of an underlying reference price may make it difficult to judge ‘fair’ value.
(iii) Deposited Cash and Property
The Customer should familiarise with the protection accorded to any money or other property which the Customer deposit for domestic and foreign transactions, particularly in a firm’s insolvency or bankruptcy. The extent to which the Customer may recover such money or property may be governed by specific legislation or local rules. In some jurisdictions, property which had been specifically identifiable as the Customer’s own will be pro-rated in the same manner as cash for purposes of distribution in the event of a shortfall.
(14d) Commission and Other Charges
Before begin to trade, the Customer should obtain a clear explanation of all commissions, fees and other charges. These charges will affect the net profit (if any) or increase loss which the Customer will be entitled or liable respectively.
(14e) Transactions in Other Jurisdictions
Transactions on markets in other jurisdictions, including markets formally linked to a domestic market, may expose the Customer to additional risk. Such markets may be subject to a rule which may offer different or diminished investor protection. Before trading, the Customer should enquire about any rules relevant to the particular transactions. The Customer’s local regulatory authority will be unable to compel the enforcement of the rules of the regulatory authorities or markets in other jurisdictions where the transactions have been effected. The Customer should ask the firm with for such transactions’ details about the types of redress available in both the Customer’s home jurisdiction and other relevant jurisdictions before starting to trade.
(14f) Currency Risks
The profit or loss in transactions in foreign currency-denominated futures and options contracts (whether they are traded in the Customer’s own or another jurisdiction) will be affected by fluctuations in currency rates where there is a need to convert from the currency denomination of the contract to another currency.
(14g) Trading Facilities
Most open-outcry and electronic trading facilities are supported by computer-based component systems for the order-routing, execution, matching, registration or clearing of trades. As with all facilities and systems, they are vulnerable to temporary disruption or failure. The Customer’s ability to recover certain losses may be subject to limits on liability imposed by the one or more parties, namely the system provider, the market, the clearing house or member firms. Such limits may vary. The Customer should ask the firm for such transactions’ details in this respect.
(14h) Electronic Trading
Trading on an electronic trading system may differ not only from trading in an open outcry market but also from trading on other electronic trading systems. If the Customer undertake transactions on an electronic trading system, the Customer will be exposed to risks associated with the system including the failure of hardware and software. The result of any system failure may be that the Order is either not executed according to the communication of the Customer or not executed at all.
(14i) Off-Exchange Transactions
In some jurisdictions, firms are permitted to effect off-exchange transactions. The firm with which the Customer conduct the transactions may be acting as the Customer’s counterparty to the transaction. It may be difficult or impossible to liquidate an existing position, to assess the value, to determine a fair price or to assess the exposure to risk. For these reasons, these transactions may involve increased risks. Off-exchange transactions may be less regulated or subject to a separate regulatory regime. Before the Customer undertake such transactions, the Customer should familiarise with the applicable rules and attendant risks.
(14j) Payment Token Derivatives (PTDs)
Transactions in PTDs such as Cryptocurrency Futures carry a high degree of risk, and may not be suitable for all investors. Losses may exceed deposits. Do conduct due diligence and consult financial advisor before making any trading decisions. The Customer should carefully consider whether such trading is appropriate in the light of its experience, objectives, financial resources and other relevant circumstances. In considering to trade, the Customer should be aware of the following risks, which include but are not limited to:
(i) Lack of Legislative Protection by Monetary Authority of Singapore (MAS)
Cryptocurrencies are not legal tender and are not issued by any government nor backed by any asset or issuer. Cryptocurrencies are currently not subjected to any regulatory requirements or supervisory oversight by the MAS. Hence, the safeguards afforded under MAS’ regulatory framework will not apply to consumers dealing with unregulated products, such as CFDs on Cryptocurrencies.
(ii) Extreme Volatility
Cryptocurrencies have little or no intrinsic value, making them hard to value and extremely volatile. Being highly speculative, investing in cryptocurrencies entails high risks as prices are prone to sharp, sudden swings as a result of unanticipated events or changes in market sentiments primarily due to the lack of price transparency.
(iii) Liquidity Risks and Price Slippages
Cryptocurrencies is a relatively new asset class and regulations, or a lack thereof, may have an impact on liquidity which in turn may result in unwanted price slippages. This is exacerbated in times of market volatility.
Possible failure of cryptocurrency exchanges may also increase illiquidity.
(iv) Cybersecurity Risks
Being a virtual, decentralized currency with no overarching regulatory body, cryptocurrency intermediaries are vulnerable to security breaches and market manipulations. Technical glitches on cryptocurrency intermediaries may happen as well. Such scenarios may cause disruption to trading and may cause substantial volatility in prices.
(v) Hard Forks
A hard fork changes the software, making it not backward compatible. Blocks running the new software will not be recognized and work with users running the older software, essentially splitting a single cryptocurrency into two. Hard forks may cause substantial volatility in prices.
Exchanges may in its sole discretion, take alternative action with respect to hard forks in consultation with market participants as may be appropriate.
Phillip Nova will endeavor to inform Customers of any hard forks but it is ultimately the Customer’s responsibility to be aware of them.
(vi) Weekend Gap Risk on Cryptocurrencies
Major cryptocurrencies trade 24 hours including weekends. However, Cryptocurrency Futures offered by Phillip Nova are not tradable on weekends and have specific trading hours. This may result in wide price gaps when the market opens after weekends that experienced market volatility.
Trading in PTDs such as futures contracts, cryptocurrency CFDs, debentures and/or collective investment schemes such as funds and ETFs that reference digital payment tokens (or cryptocurrencies) carries a high level of risk. The Customer runs the risk of losing all of their invested capital, or potentially more.The customer must be fully aware of the following risks associated with both derivatives and products that invest in cryptocurrencies, and carefully assess whether these products are suitable for their investment objectives and risk appetite:
(i) Lack of Legislative Protection by Monetary Authority of Singapore (MAS)
Cryptocurrencies have a wide range of attributes, characteristics and features and most cryptocurrencies fall outside of the ambit of the Payment Services Act. Therefore, the safeguards afforded under the Monetary Authority of Singapore (MAS) regulatory framework may not apply to investors dealing in unregulated products such as these cryptocurrencies.
(ii) Extreme Volatility
Cryptocurrencies have no central authority and are not backed by any government, have little or no intrinsic value, and exhibit high volatility. PTDs and investment products with exposure or investments in cryptocurrencies are prone to sudden sharp swings as a result of unanticipated events or changes in market sentiments primarily due to the lack of price transparency;
(iii) Liquidity Risks
Liquidity may also become limited and price gaps may occur in such circumstances;
(iv) Cybersecurity Risks
Cryptocurrency exchanges, where cryptocurrencies are bought and traded, may be susceptible to cyber security breaches. In the event of a cyberattack and theft of cryptocurrencies, it may result in drastic, adverse price movements.
Frequently Asked Questions
Generally, use these easy steps to purchase cryptocurrency:
- Select a broker or cryptocurrency exchange
- Register for an account and verify it
- Deposit money to invest
- Place your order for cryptocurrency
- Pick a storage approach
You may purchase cryptocurrencies using alternative methods, such as:
It is important to consider if the popularity that cryptocurrencies have achieved over time is real. Cryptocurrency, particularly Bitcoin, has, even though it is still far from replacing institutionalised cash, gained widespread acceptability worldwide.
They can be used as a mode of payment. Bitcoin was initially of limited value as a method of payment to retailers. But over time, many businesses, including eateries, airlines, jewellers, and apps, have begun to recognise it as a legitimate form of payment.
Additionally, cryptocurrencies, particularly Bitcoin, are among the most profitable investment opportunities available. Its value growth is dynamic and may be a great route for capital growth.
The price of cryptocurrencies is highly volatile and can change rapidly. Governments or financial institutions do not regulate cryptocurrencies, so their value is determined by supply and demand on the open market. The price of a cryptocurrency is also influenced by factors such as media coverage, public interest, and even rumours.
Bitcoins are kept in a digital wallet, just like we store credit cards or cash in a physical wallet. Digital wallets can be web-based or hardware-based. The wallet can be stored on a desktop computer or mobile device or kept secure by writing the private keys and access addresses on paper.
Some of the safest methods to keep cryptocurrency are in custodial and hardware wallets, but each has benefits and limitations.
For certain companies, the use of cryptocurrencies may present opportunities. The advantages might include the following:
- A crypto transaction often happens quickly. For instance, only a computer or smartphone is required to move Bitcoins from one digital wallet to another.
- Cheaper and quicker money transactions and decentralised networks that do not have a sole point of failure are two benefits of cryptocurrencies.
- Blockchain seeks to eliminate middlemen like banks and internet marketplaces, so there are no transaction costs.
- Payments made using cryptocurrencies are becoming more common among big businesses and industries like fashion and medicine.
Cryptocurrencies’ drawbacks include their unstable prices, high energy requirements for mining, and usage in illegal activities. Additionally, cyber attacks often target cryptocurrency exchanges, which might mean that you permanently lose your investments.
Related Terms
- Compound Yield
- Discretionary Accounts
- Industry Groups
- Growth Rate
- Foreign Direct Investment (FDI)
- Floating Dividend Rate
- Real Return
- Non-Diversifiable Risk
- Liability-Driven Investment (LDI)
- Guaranteed Investment Contract (GIC)
- Flash Crash
- Cost Basis
- Deferred Annuity
- Cash-on-Cash Return
- Bubble
- Asset Play
- Accrued Market Discount
- Inflation Hedge
- Incremental Yield
- Holding Period Return
- Hedge Effectiveness
- Fallen Angel
- EBITDA Margin
- Dollar Rolls
- Dividend Declaration Date
- Distribution Yield
- Derivative Security
- Fiduciary
- Current Yield
- Core Position
- Cash Dividend
- Broken Date
- Share Classes
- Valuation Point
- Breadth Thrust Indicator
- Book-Entry Security
- Bearish Engulfing
- Core inflation
- Approvеd Invеstmеnts
- Allotment
- Annual Earnings Growth
- Solvency
- Impersonators
- Reinvestment date
- Volatile Market
- Trustee
- Sum-of-the-Parts Valuation (SOTP)
- Proxy Voting
- Passive Income
- Diversifying Portfolio
- Open-ended scheme
- Capital Gains Distribution
- Investment Insights
- Discounted Cash Flow (DCF)
- Portfolio manager
- Net assets
- Nominal Return
- Systematic Investment Plan
- Issuer Risk
- Fundamental Analysis
- Account Equity
- Withdrawal
- Realised Profit/Loss
- Unrealised Profit/Loss
- Negotiable Certificates of Deposit
- High-Quality Securities
- Shareholder Yield
- Conversion Privilege
- Cash Reserve
- Factor Investing
- Open-Ended Investment Company
- Front-End Load
- Tracking Error
- Replication
- Real Yield
- DSPP
- Bought Deal
- Bulletin Board System
- Portfolio turnover rate
- Reinvestment privilege
- Initial purchase
- Subsequent Purchase
- Fund Manager
- Target Price
- Top Holdings
- Liquidation
- Direct market access
- Deficit interest
- EPS forecast
- Adjusted distributed income
- International securities exchanges
- Margin Requirement
- Pledged Asset
- Stochastic Oscillator
- Prepayment risk
- Homemade leverage
- Prime bank investments
- ESG
- Capitulation
- Shareholder service fees
- Insurable Interest
- Minority Interest
- Passive Investing
- Market cycle
- Progressive tax
- Correlation
- NFT
- Carbon credits
- Hyperinflation
- Hostile takeover
- Travel insurance
- Money market
- Dividend investing
- Digital Assets
- Coupon yield
- Counterparty
- Sharpe ratio
- Alpha and beta
- Investment advisory
- Wealth management
- Variable annuity
- Asset management
- Value of Land
- Investment Policy
- Investment Horizon
- Forward Contracts
- Equity Hedging
- Encumbrance
- Money Market Instruments
- Share Market
- Opening price
- Transfer of Shares
- Alternative investments
- Lumpsum
- Derivatives market
- Operating assets
- Hypothecation
- Accumulated dividend
- Assets under management
- Endowment
- Return on investment
- Investments
- Acceleration clause
- Heat maps
- Lock-in period
- Tranches
- Stock Keeping Unit
- Real Estate Investment Trusts
- Prospectus
- Turnover
- Tangible assets
- Preference Shares
- Open-ended investment company
- Ordinary Shares
- Leverage
- Standard deviation
- Independent financial adviser
- ESG investing
- Earnest Money
- Primary market
- Leveraged Loan
- Transferring assets
- Shares
- Fixed annuity
- Underlying asset
- Quick asset
- Portfolio
- Mutual fund
- Xenocurrency
- Bitcoin Mining
- Option contract
- Depreciation
- Inflation
- Options
- Fixed income
- Asset
- Reinvestment option
- Capital appreciation
- Style Box
- Top-down Investing
- Trail commission
- Unit holder
- Yield curve
- Rebalancing
- Vesting
- Private equity
- Bull Market
- Absolute Return
- Leaseback
- Impact investing
- Venture Capital
- Buy limit
- Asset stripper
- Volatility
- Investment objective
- Annuity
- Sustainable investing
- Face-amount certificate
- Lipper ratings
- Investment stewardship
- Average accounting return
- Asset class
- Active management
- Breakpoint
- Expense ratio
- Bear market
- Hedging
- Equity options
- Dollar-Cost Averaging (DCA)
- Due Diligence
- Contrarian Investor
Most Popular Terms
Other Terms
- Bond Convexity
- Brokerage Account
- Green Bond Principles
- Gamma Scalping
- Funding Ratio
- Free-Float Methodology
- Flight to Quality
- Protective Put
- Perpetual Bond
- Option Adjusted Spread (OAS)
- Merger Arbitrage
- Income Bonds
- Equity Carve-Outs
- Cost of Equity
- Earning Surprise
- Capital Adequacy Ratio (CAR)
- Beta Risk
- Bear Spread
- Ladder Strategy
- Junk Status
- Intrinsic Value of Stock
- Interest-Only Bonds (IO)
- Interest Coverage Ratio
- Industry Groups
- Industrial Bonds
- Income Statement
- Historical Volatility (HV)
- Flat Yield Curve
- Exotic Options
- Execution Risk
- Exchange-Traded Notes
- Event-Driven Strategy
- Eurodollar Bonds
- Enhanced Index Fund
- Embedded Options
- Dynamic Asset Allocation
- Dual-Currency Bond
- Downside Capture Ratio
- Dividend Capture Strategy
- Depositary Receipts
- Delta Neutral
- Deferment Payment Option
- Dark Pools
- Death Cross
- Debt-to-Equity Ratio
- Fixed-to-floating rate bonds
- First Call Date
- Financial Futures
- Firm Order
- Credit Default Swap (CDS)
Know More about
Tools/Educational Resources
Markets Offered by POEMS
Read the Latest Market Journal

Singapore Catalist Board IPOs Outperform Mainboard; US Mega-Cap Strategy Favours Short-Term Trading
Singapore IPO Performance Reveals a Market Divide Recent analysis of Singapore's initial public offering (IPO) landscape reveals a stark performance disparity between the Mainboard and Catalist Board listings, with significant implications for investors seeking exposure to newly listed companies. Singapore Mainboard IPOs have delivered disappointing results, generating an average first-day return of -2%. This lacklustre performance is further highlighted by the fact that only one-third of IPOs managed to close above their IPO price on their debut trading day. Catalist Board Emerges as the Superior Option In contrast, Singapore's Catalist Board listings present a markedly different proposition for investors. These smaller-cap offerings have delivered reliable double-digit gains on their opening day, averaging an impressive 19.8%. The sustained post-listing gains further enhance the risk-reward profile for short-term IPO speculation. The Catalist Board's average performance across various timeframes demonstrates consistent strength, with 50.5% returns after one week, 54.3% after one month, 88.3% after three months, and 114.4% after six months. US IPO Strategy Recommendations For major US IPOs, the optimal approach differs significantly from the strategies used in Singapore. Large US offerings typically generate strong opening day momentum, averaging gains of 16%. However, the recommended strategy involves riding the initial one-week to one-month momentum wave before exiting positions ahead of lock-up expirations. Importantly, historical data suggests that buying and holding mega-cap IPOs through their first year has proven to be a value-destructive proposition, making timing crucial for US IPO investments. The analysis indicates that traders seeking short-term IPO speculation should favour Singapore's Catalist Board offerings over Mainboard listings, whilst US IPO strategies should focus on capturing initial momentum rather than long-term holding. Frequently Asked Questions [market_journal_faq] This article has been auto-generated using PhillipGPT. It is based on a report by a Phillip Securities Research analyst. Disclaimer These commentaries are intended for general circulation and do not have regard to the specific investment objectives, financial situation and particular needs of any person. Accordingly, no warranty whatsoever is given and no liability whatsoever is accepted for any loss arising whether directly or indirectly as a result of any person acting based on this information. You should seek advice from a financial adviser regarding the suitability of any investment product(s) mentioned herein, taking into account your specific investment objectives, financial situation or particular needs, before making a commitment to invest in such products. Opinions expressed in these commentaries are subject to change without notice. Investments are subject to investment risks including the possible loss of the principal amount invested. The value of units in any fund and the income from them may fall as well as rise. Past performance figures as well as any projection or forecast used in these commentaries are not necessarily indicative of future or likely performance. Phillip Securities Pte Ltd (PSPL), its directors, connected persons or employees may from time to time have an interest in the financial instruments mentioned in these commentaries. The information contained in these commentaries has been obtained from public sources which PSPL has no reason to believe are unreliable and any analysis, forecasts, projections, expectations and opinions (collectively the “Research”) contained in these commentaries are based on such information and are expressions of belief only. PSPL has not verified this information and no representation or warranty, express or implied, is made that such information or Research is accurate, complete or verified or should be relied upon as such. Any such information or Research contained in these commentaries are subject to change, and PSPL shall not have any responsibility to maintain the information or Research made available or to supply any corrections, updates or releases in connection therewith. In no event will PSPL be liable for any special, indirect, incidental or consequential damages which may be incurred from the use of the information or Research made available, even if it has been advised of the possibility of such damages. The companies and their employees mentioned in these commentaries cannot be held liable for any errors, inaccuracies and/or omissions howsoever caused. Any opinion or advice herein is made on a general basis and is subject to change without notice. The information provided in these commentaries may contain optimistic statements regarding future events or future financial performance of countries, markets or companies. You must make your own financial assessment of the relevance, accuracy and adequacy of the information provided in these commentaries. Views and any strategies described in these commentaries may not be suitable for all investors. Opinions expressed herein may differ from the opinions expressed by other units of PSPL or its connected persons and associates. Any reference to or discussion of investment products or commodities in these commentaries is purely for illustrative purposes only and must not be construed as a recommendation, an offer or solicitation for the subscription, purchase or sale of the investment products or commodities mentioned. This advertisement has not been reviewed by the Monetary Authority of Singapore.

Singapore Banking Sector Upgraded to ACCUMULATE on Rising Loan Growth and Rate Stabilisation
Company Overview This analysis covers Singapore's major banking sector, focusing on the three primary banks: DBS, OCBC, and UOB. These institutions represent the core of Singapore's financial services landscape, serving both domestic and regional markets whilst benefiting from the city-state's position as a financial hub. Upgrade to ACCUMULATE Rating Phillip Securities Research has upgraded the Singapore banking sector to ACCUMULATE from Neutral, driven by accelerating loan growth, stabilising interest rates, and improved market conditions. The research house has raised target prices across all three major banks: DBS to S$76.00 from S$67.50, OCBC to S$28.50 from S$24.00, and UOB to S$43.00 from S$39.00, reflecting higher loan growth and earnings estimates. Interest Rate Environment Stabilising Singapore's 3-month SORA rose for the second consecutive month, increasing 1 basis point month-on-month to 1.07% in June. This represents the smallest year-on-year decline in 15 months at 109 basis points, suggesting that rates are beginning to bottom out. The stabilisation reflects the Federal Reserve's increasingly hawkish stance, with June projections signalling a possible rate hike and no cuts anticipated, creating a supportive backdrop for net interest margins. Strong Loan Growth and Deposit Trends Singapore loan growth continued its surge at 8.7% year-on-year, potentially leading to upward revisions to previous guidance to low- to mid-single digit growth. Current account and savings account (CASA) deposits rose 15% year-on-year, with the CASA deposits ratio improving to 20.7% from 20.5% in April, reaching the highest level since November 2022. This trend provides a tailwind for banks by lowering funding costs and cushioning net interest margin compression. Market Volatility Benefits Ongoing geopolitical tensions, including the collapsed US-Iran ceasefire and renewed strikes lifting oil prices, continue to generate market volatility. This environment benefits capital markets income and wealth management fees, providing meaningful offsets to net interest income headwinds. The sector offers attractive dividend yields of 4.1%, with ongoing share buybacks improving return on equity. DBS is preferred for its fixed dividend policy and guidance upgrade, whilst OCBC is favoured for wealth management growth and excess capital. Frequently Asked Questions [market_journal_faq] This article has been auto-generated using PhillipGPT. It is based on a report by a Phillip Securities Research analyst. Disclaimer These commentaries are intended for general circulation and do not have regard to the specific investment objectives, financial situation and particular needs of any person. Accordingly, no warranty whatsoever is given and no liability whatsoever is accepted for any loss arising whether directly or indirectly as a result of any person acting based on this information. You should seek advice from a financial adviser regarding the suitability of any investment product(s) mentioned herein, taking into account your specific investment objectives, financial situation or particular needs, before making a commitment to invest in such products. Opinions expressed in these commentaries are subject to change without notice. Investments are subject to investment risks including the possible loss of the principal amount invested. The value of units in any fund and the income from them may fall as well as rise. Past performance figures as well as any projection or forecast used in these commentaries are not necessarily indicative of future or likely performance. Phillip Securities Pte Ltd (PSPL), its directors, connected persons or employees may from time to time have an interest in the financial instruments mentioned in these commentaries. The information contained in these commentaries has been obtained from public sources which PSPL has no reason to believe are unreliable and any analysis, forecasts, projections, expectations and opinions (collectively the “Research”) contained in these commentaries are based on such information and are expressions of belief only. PSPL has not verified this information and no representation or warranty, express or implied, is made that such information or Research is accurate, complete or verified or should be relied upon as such. Any such information or Research contained in these commentaries are subject to change, and PSPL shall not have any responsibility to maintain the information or Research made available or to supply any corrections, updates or releases in connection therewith. In no event will PSPL be liable for any special, indirect, incidental or consequential damages which may be incurred from the use of the information or Research made available, even if it has been advised of the possibility of such damages. The companies and their employees mentioned in these commentaries cannot be held liable for any errors, inaccuracies and/or omissions howsoever caused. Any opinion or advice herein is made on a general basis and is subject to change without notice. The information provided in these commentaries may contain optimistic statements regarding future events or future financial performance of countries, markets or companies. You must make your own financial assessment of the relevance, accuracy and adequacy of the information provided in these commentaries. Views and any strategies described in these commentaries may not be suitable for all investors. Opinions expressed herein may differ from the opinions expressed by other units of PSPL or its connected persons and associates. Any reference to or discussion of investment products or commodities in these commentaries is purely for illustrative purposes only and must not be construed as a recommendation, an offer or solicitation for the subscription, purchase or sale of the investment products or commodities mentioned. This advertisement has not been reviewed by the Monetary Authority of Singapore.

Strategic Acquisitions Drive Growth Q & M Dental Group Ltd has announced significant expansion plans through two major acquisitions that will substantially increase its regional footprint. The Singapore-based dental services provider is acquiring a 100% stake in Australia's Experteeth Dental Group and a 51% stake in Thailand's Deezy Dental Home for approximately S$107 million and S$39 million respectively. Company Profile Q & M Dental Group operates as a comprehensive dental services provider across the Asia-Pacific region. The company has established itself as a regional healthcare player in the healthcare sector, focusing on dental care services and clinic operations across multiple markets. Acquisition Details and Financing Structure The combined S$146 million purchase will be financed through S$92 million in cash and the issuance of 86.7 million new shares, representing 9.1% of existing shares. The new shares are priced at S$0.70 each and will be subject to a 15-year moratorium, ensuring long-term commitment from the vendors. The Australian acquisition targets Experteeth Dental Group, founded in 2017, which operates 40 dental clinics with 117 dentists across New South Wales, Victoria, Queensland, Tasmania, and the Australian Capital Territory. The group operates under multiple established brands including Elevate Dental Group, Lumiere Dental Group, Ace Dental Group, Yiruda Dental Group, Prestige Dental Group, and Bubble Teeth Dental Group. The Thai acquisition involves Deezy Dental Home, also founded in 2017, which operates three dental clinics with 41 dentists. Strong Financial Backing and Growth Prospects The acquisitions are valued at an attractive price-to-earnings ratio of 11.4 times, with the Australian operation at 10 times and the Thai operation at 16 times. Importantly, the total S$146 million investment is supported by robust profit guarantees totalling S$126 million over six to eight years. This arrangement implies earnings growth of approximately 13%, with Thailand showing the highest growth potential at 22% compound annual growth rate. Analyst Outlook Phillip Securities Research maintains a positive outlook on these acquisitions, projecting that they could increase FY26 earnings per share by 1.04 cents, representing a 54% increase to 2.96 cents, excluding intangible amortisation. The research house maintains its BUY recommendation with an unchanged target price of S$0.71, based on price-to-earnings ratio of 25 times for FY26, aligned with Singapore's healthcare sector valuation. Frequently Asked Questions [market_journal_faq] This article has been auto-generated using PhillipGPT. It is based on a report by a Phillip Securities Research analyst. Disclaimer These commentaries are intended for general circulation and do not have regard to the specific investment objectives, financial situation and particular needs of any person. Accordingly, no warranty whatsoever is given and no liability whatsoever is accepted for any loss arising whether directly or indirectly as a result of any person acting based on this information. You should seek advice from a financial adviser regarding the suitability of any investment product(s) mentioned herein, taking into account your specific investment objectives, financial situation or particular needs, before making a commitment to invest in such products. Opinions expressed in these commentaries are subject to change without notice. Investments are subject to investment risks including the possible loss of the principal amount invested. The value of units in any fund and the income from them may fall as well as rise. Past performance figures as well as any projection or forecast used in these commentaries are not necessarily indicative of future or likely performance. Phillip Securities Pte Ltd (PSPL), its directors, connected persons or employees may from time to time have an interest in the financial instruments mentioned in these commentaries. The information contained in these commentaries has been obtained from public sources which PSPL has no reason to believe are unreliable and any analysis, forecasts, projections, expectations and opinions (collectively the “Research”) contained in these commentaries are based on such information and are expressions of belief only. PSPL has not verified this information and no representation or warranty, express or implied, is made that such information or Research is accurate, complete or verified or should be relied upon as such. Any such information or Research contained in these commentaries are subject to change, and PSPL shall not have any responsibility to maintain the information or Research made available or to supply any corrections, updates or releases in connection therewith. In no event will PSPL be liable for any special, indirect, incidental or consequential damages which may be incurred from the use of the information or Research made available, even if it has been advised of the possibility of such damages. The companies and their employees mentioned in these commentaries cannot be held liable for any errors, inaccuracies and/or omissions howsoever caused. Any opinion or advice herein is made on a general basis and is subject to change without notice. The information provided in these commentaries may contain optimistic statements regarding future events or future financial performance of countries, markets or companies. You must make your own financial assessment of the relevance, accuracy and adequacy of the information provided in these commentaries. Views and any strategies described in these commentaries may not be suitable for all investors. Opinions expressed herein may differ from the opinions expressed by other units of PSPL or its connected persons and associates. Any reference to or discussion of investment products or commodities in these commentaries is purely for illustrative purposes only and must not be construed as a recommendation, an offer or solicitation for the subscription, purchase or sale of the investment products or commodities mentioned. This advertisement has not been reviewed by the Monetary Authority of Singapore.

Semiconductor Sector Sustains Strong Growth Momentum with Accelerating Revenue Expansion
Sector Performance Driven by Memory Boom and AI Infrastructure Demand The semiconductor sector continues to demonstrate robust growth momentum, with the Semiconductor ETF surging 39.9% over the past three months, significantly outperforming the S&P 500's 11.4% gain. Memory companies have emerged as the standout performers, posting exceptional gains of 95% driven by extraordinary first-quarter 2026 earnings growth exceeding 900% year-on-year. This remarkable performance stems from a substantial surge in DRAM and NAND prices amid widespread memory chip shortages. Extended Supply Contracts Signal Long-Term Industry Stability A notable shift in industry dynamics has emerged through the establishment of longer-term supply agreements. Hyperscalers and high-end chipmakers are now committing to multi-year contracts extending until 2030, representing a significant departure from previous agreements that typically lasted only one year with flexible financing terms. These new arrangements require approximately 20% cash deposits to secure supply, demonstrating the critical importance of memory chips in AI data centre buildouts. Equipment manufacturers report that these extended memory contracts provide enhanced supply chain visibility extending through the end of 2027. Processor Segment Shows Accelerating Growth Trajectory The processor segment continues its growth acceleration, with first-quarter 2026 revenue surging 53% year-on-year, up from 40% growth in the fourth quarter of 2025. This momentum is expected to continue, with second-quarter 2026 revenue guidance indicating a substantial 67% year-on-year increase to US$159 billion. The growth is underpinned by robust hyperscaler demand for data centre GPUs, CPUs, and ASICs. NVIDIA leads the sector with first-quarter revenue spiking 85% year-on-year to US$81.6 billion, marking the third consecutive quarter of accelerating growth. AMD demonstrated its strongest year-on-year growth since 2022, with revenue increasing 38% to US$10.3 billion, driven by MI350 GPU and fifth-generation EPYC CPU adoption. Broadcom achieved its strongest growth since 2016, with revenue rising 48% year-on-year to US$22.2 billion, supported by AI semiconductor revenue that grew 143% year-on-year to a record US$10.8 billion. The sector maintains strong forward momentum, supported by hyperscalers' combined 2026 capital expenditure guidance of US$710 billion, representing an 89% year-on-year increase. Equipment players continue to benefit from strong services demand as memory customers seek performance upgrades on existing tools due to limited cleanroom space. Frequently Asked Questions [market_journal_faq] This article has been auto-generated using PhillipGPT. It is based on a report by a Phillip Securities Research analyst. Disclaimer These commentaries are intended for general circulation and do not have regard to the specific investment objectives, financial situation and particular needs of any person. Accordingly, no warranty whatsoever is given and no liability whatsoever is accepted for any loss arising whether directly or indirectly as a result of any person acting based on this information. You should seek advice from a financial adviser regarding the suitability of any investment product(s) mentioned herein, taking into account your specific investment objectives, financial situation or particular needs, before making a commitment to invest in such products. Opinions expressed in these commentaries are subject to change without notice. Investments are subject to investment risks including the possible loss of the principal amount invested. The value of units in any fund and the income from them may fall as well as rise. Past performance figures as well as any projection or forecast used in these commentaries are not necessarily indicative of future or likely performance. Phillip Securities Pte Ltd (PSPL), its directors, connected persons or employees may from time to time have an interest in the financial instruments mentioned in these commentaries. The information contained in these commentaries has been obtained from public sources which PSPL has no reason to believe are unreliable and any analysis, forecasts, projections, expectations and opinions (collectively the “Research”) contained in these commentaries are based on such information and are expressions of belief only. PSPL has not verified this information and no representation or warranty, express or implied, is made that such information or Research is accurate, complete or verified or should be relied upon as such. Any such information or Research contained in these commentaries are subject to change, and PSPL shall not have any responsibility to maintain the information or Research made available or to supply any corrections, updates or releases in connection therewith. In no event will PSPL be liable for any special, indirect, incidental or consequential damages which may be incurred from the use of the information or Research made available, even if it has been advised of the possibility of such damages. The companies and their employees mentioned in these commentaries cannot be held liable for any errors, inaccuracies and/or omissions howsoever caused. Any opinion or advice herein is made on a general basis and is subject to change without notice. The information provided in these commentaries may contain optimistic statements regarding future events or future financial performance of countries, markets or companies. You must make your own financial assessment of the relevance, accuracy and adequacy of the information provided in these commentaries. Views and any strategies described in these commentaries may not be suitable for all investors. Opinions expressed herein may differ from the opinions expressed by other units of PSPL or its connected persons and associates. Any reference to or discussion of investment products or commodities in these commentaries is purely for illustrative purposes only and must not be construed as a recommendation, an offer or solicitation for the subscription, purchase or sale of the investment products or commodities mentioned. This advertisement has not been reviewed by the Monetary Authority of Singapore.

Singapore Airlines Benefits from Fuel Hedging Amid Jet Fuel Volatility, Maintains Market Position
Aviation Sector Performance and Fuel Dynamics Singapore's aviation sector delivered steady performance in June 2026, with SATS leading gains at 14.2%, followed by Singapore Airlines at 11.6% and SIA Engineering at 7.3%. Meanwhile, CAO declined 1.1%. The sector continues to navigate volatile jet fuel markets, with Singapore jet fuel prices currently trading at US$115 per barrel, down significantly from the March 2026 peak of US$240.5 per barrel following a US-Iran peace deal that reduced prices by approximately 50%. Singapore Airlines' Strategic Positioning Singapore Airlines has demonstrated resilience through its comprehensive hedging strategy and operational adaptability. The carrier maintains a dual hedge structure covering both Brent crude and jet fuel, with 35% hedging on jet fuel and 14% on Brent crude for the second quarter of FY2026/27. This positioning has provided relative insulation from fuel price volatility compared to unhedged competitors. The airline has capitalised on several market opportunities, including rerouted demand for Asia-Europe flights stopping over in Singapore due to regional conflicts. Additionally, Singapore Airlines benefits from rising cargo yields, with global freight rates increasing 41% year-on-year to US$3.40 per kilogram. The company's budget subsidiary, Scoot, has captured demand from regional low-cost carriers that grounded aircraft during the conflict period. Market Outlook and Competitive Landscape Despite current price reductions, jet fuel remains approximately 33% above the 2025 averages of US$90 per barrel. Regional carriers show varying degrees of hedging protection, with Singapore Airlines, Cathay Pacific, Japan Airlines, and ANA maintaining stronger hedged positions. Conversely, China's Big Three airlines—Air China, China Southern, and China Eastern—remain largely unhedged and face greater exposure to fuel price fluctuations. The cargo segment presents additional opportunities, as the partial grounding of Middle East airlines has removed significant capacity from India-Europe and China/Southeast Asia-Europe routes. This capacity reduction has pushed Asia-Europe spot rates to US$5.26 per kilogram in late June, representing a 38% year-on-year increase. While Singapore Airlines' cargo revenue exposure of 11% makes it a secondary beneficiary compared to carriers with higher cargo proportions, the company still stands to benefit from elevated rates. Analysts maintain a neutral stance on air transportation, given uncertain resolution of geopolitical conflicts and the potential for renewed fuel price volatility if ceasefires break down. Frequently Asked Questions [market_journal_faq] This article has been auto-generated using PhillipGPT. It is based on a report by a Phillip Securities Research analyst. Disclaimer These commentaries are intended for general circulation and do not have regard to the specific investment objectives, financial situation and particular needs of any person. Accordingly, no warranty whatsoever is given and no liability whatsoever is accepted for any loss arising whether directly or indirectly as a result of any person acting based on this information. You should seek advice from a financial adviser regarding the suitability of any investment product(s) mentioned herein, taking into account your specific investment objectives, financial situation or particular needs, before making a commitment to invest in such products. Opinions expressed in these commentaries are subject to change without notice. Investments are subject to investment risks including the possible loss of the principal amount invested. The value of units in any fund and the income from them may fall as well as rise. Past performance figures as well as any projection or forecast used in these commentaries are not necessarily indicative of future or likely performance. Phillip Securities Pte Ltd (PSPL), its directors, connected persons or employees may from time to time have an interest in the financial instruments mentioned in these commentaries. The information contained in these commentaries has been obtained from public sources which PSPL has no reason to believe are unreliable and any analysis, forecasts, projections, expectations and opinions (collectively the “Research”) contained in these commentaries are based on such information and are expressions of belief only. PSPL has not verified this information and no representation or warranty, express or implied, is made that such information or Research is accurate, complete or verified or should be relied upon as such. Any such information or Research contained in these commentaries are subject to change, and PSPL shall not have any responsibility to maintain the information or Research made available or to supply any corrections, updates or releases in connection therewith. In no event will PSPL be liable for any special, indirect, incidental or consequential damages which may be incurred from the use of the information or Research made available, even if it has been advised of the possibility of such damages. The companies and their employees mentioned in these commentaries cannot be held liable for any errors, inaccuracies and/or omissions howsoever caused. Any opinion or advice herein is made on a general basis and is subject to change without notice. The information provided in these commentaries may contain optimistic statements regarding future events or future financial performance of countries, markets or companies. You must make your own financial assessment of the relevance, accuracy and adequacy of the information provided in these commentaries. Views and any strategies described in these commentaries may not be suitable for all investors. Opinions expressed herein may differ from the opinions expressed by other units of PSPL or its connected persons and associates. Any reference to or discussion of investment products or commodities in these commentaries is purely for illustrative purposes only and must not be construed as a recommendation, an offer or solicitation for the subscription, purchase or sale of the investment products or commodities mentioned. This advertisement has not been reviewed by the Monetary Authority of Singapore.

Gold in 2026: Why Analysts Believe the Rally May Continue
Gold has emerged as one of the strongest-performing major asset classes, attracting investors seeking portfolio diversification and protection against economic uncertainty. After delivering exceptional returns in 2025, many market analysts continue to see upside potential for gold in 2026. Gold at a Glance Metric Value Spot Gold Price (11 June 2026) US$4,073/oz 2026 Peak Price US$5,595/oz J.P. Morgan Bull Case Target US$6,300/oz 2025 Return +60% These figures illustrate why gold remains one of the most discussed asset classes among investors. Ways to Invest in Gold Investors can gain exposure to gold through several investment vehicles, each offering different benefits and risks. Investment Type Suitable For Key Benefits Physical Gold Long-term holders Direct ownership Gold ETFs Most retail investors Low cost, easy trading Mining Stocks Growth investors Potentially higher returns Futures & CFDs Experienced traders Leveraged exposure Why Many Investors Prefer Gold ETFs Gold ETFs have become one of the easiest ways to invest in gold because they offer exposure to the price of gold without the need to buy, store, or insure physical bullion. The infographic compares US-listed Gold ETFs and highlights their management fees and fund sizes. The Investment Case for Gold Gold has historically been viewed as both a defensive asset and a portfolio diversifier. During periods of inflation, geopolitical uncertainty, or financial market volatility, investors often increase their allocations to gold. Why Investors Consider Gold Acts as a hedge against inflation Diversifies investment portfolios Preserves purchasing power over time Can perform well during market uncertainty Offers high global liquidity Should You Buy Physical Gold or Gold ETFs? For most retail investors, Gold ETFs offer several advantages: Feature Physical Gold Gold ETF Storage Required Yes No Easy to Trade Limited Yes Brokerage Account No Yes Liquidity Moderate High Ongoing Costs Storage & Insurance Management Fee Frequently Asked Questions [market_journal_faq] Disclaimer These commentaries are intended for general circulation and do not have regard to the specific investment objectives, financial situation and particular needs of any person. Accordingly, no warranty whatsoever is given and no liability whatsoever is accepted for any loss arising whether directly or indirectly as a result of any person acting based on this information. You should seek advice from a financial adviser regarding the suitability of any investment product(s) mentioned herein, taking into account your specific investment objectives, financial situation or particular needs, before making a commitment to invest in such products. Opinions expressed in these commentaries are subject to change without notice. Investments are subject to investment risks including the possible loss of the principal amount invested. The value of units in any fund and the income from them may fall as well as rise. Past performance figures as well as any projection or forecast used in these commentaries are not necessarily indicative of future or likely performance. Phillip Securities Pte Ltd (PSPL), its directors, connected persons or employees may from time to time have an interest in the financial instruments mentioned in these commentaries. The information contained in these commentaries has been obtained from public sources which PSPL has no reason to believe are unreliable and any analysis, forecasts, projections, expectations and opinions (collectively the “Research”) contained in these commentaries are based on such information and are expressions of belief only. PSPL has not verified this information and no representation or warranty, express or implied, is made that such information or Research is accurate, complete or verified or should be relied upon as such. Any such information or Research contained in these commentaries are subject to change, and PSPL shall not have any responsibility to maintain the information or Research made available or to supply any corrections, updates or releases in connection therewith. In no event will PSPL be liable for any special, indirect, incidental or consequential damages which may be incurred from the use of the information or Research made available, even if it has been advised of the possibility of such damages. The companies and their employees mentioned in these commentaries cannot be held liable for any errors, inaccuracies and/or omissions howsoever caused. Any opinion or advice herein is made on a general basis and is subject to change without notice. The information provided in these commentaries may contain optimistic statements regarding future events or future financial performance of countries, markets or companies. You must make your own financial assessment of the relevance, accuracy and adequacy of the information provided in these commentaries. Views and any strategies described in these commentaries may not be suitable for all investors. Opinions expressed herein may differ from the opinions expressed by other units of PSPL or its connected persons and associates. Any reference to or discussion of investment products or commodities in these commentaries is purely for illustrative purposes only and must not be construed as a recommendation, an offer or solicitation for the subscription, purchase or sale of the investment products or commodities mentioned. This advertisement has not been reviewed by the Monetary Authority of Singapore.

Singapore Equities Show Strong Momentum as AI Cycle Drives Growth, Banks and Semiconductors Favoured
Market Performance and Outlook Singapore equities have demonstrated robust performance, posting their fourth consecutive quarter of gains with a 5.8% rise in 2Q26. The market reached record highs on 25th June and was up 11.3% for the first half of 2026. The ceasefire in the Middle East has particularly benefited transportation stocks, whilst increased volatility supported exchanges and banking shares. Expectations of bottoming interest rates have further rallied banking stocks, though energy-related equities have faced pressure from sluggish oil and gas capital expenditure and falling energy prices. AI Investment Cycle: Booming Not Bubbling Phillip Securities Research maintains that current market conditions do not constitute an AI bubble. The firm identifies several key factors supporting this view. Massive AI and data centre capital expenditure by hyperscalers, including Oracle and Meta, is expected to rise 73% in 2026 and 22% in 2027, cascading into substantial semiconductor purchases with billings rising 86% year-to-date to reach an annualised US$1 trillion . Wafer fabrication capital expenditure is projected to jump 40% year-on-year to US$175 billion. The driving force behind this spending stems from frontier AI models, particularly Anthropic and OpenAI, whose combined revenue could total US$85 billion this year. Under an S-curve growth trajectory, revenue is expected to reach US$300 billion by 2030, justifying the capital expenditure spike. Current technology sector valuations remain significantly below dot-com bubble levels, with Nvidia trading at 24 times price-to-earnings compared to Cisco's peak of 150 times forward price-to-earnings in 2000. Investment Strategy and Sector Preferences The research house favours banks, semiconductors, building materials, power, and higher-yielding REITs. Banking stocks benefit from resilient dividend yields of around 4% and loan growth surging towards 8% year-on-year, a four-year high. A major spike in deposits following the Middle East conflict, with March recording a S$66 billion jump compared to the prior five-year monthly average of S$9 billion , should help lower funding costs. Semiconductor stocks are expected to register the fastest growth, fuelled by record demand from key equipment customers including ASML, Applied Materials, and Lam Research. In construction, whilst order momentum has slowed, activity has increased, supporting a 29% rise in ready-mixed concrete demand. Frequently Asked Questions [market_journal_faq] This article has been auto-generated using PhillipGPT. It is based on a report by a Phillip Securities Research analyst. Disclaimer These commentaries are intended for general circulation and do not have regard to the specific investment objectives, financial situation and particular needs of any person. Accordingly, no warranty whatsoever is given and no liability whatsoever is accepted for any loss arising whether directly or indirectly as a result of any person acting based on this information. You should seek advice from a financial adviser regarding the suitability of any investment product(s) mentioned herein, taking into account your specific investment objectives, financial situation or particular needs, before making a commitment to invest in such products. Opinions expressed in these commentaries are subject to change without notice. Investments are subject to investment risks including the possible loss of the principal amount invested. The value of units in any fund and the income from them may fall as well as rise. Past performance figures as well as any projection or forecast used in these commentaries are not necessarily indicative of future or likely performance. Phillip Securities Pte Ltd (PSPL), its directors, connected persons or employees may from time to time have an interest in the financial instruments mentioned in these commentaries. The information contained in these commentaries has been obtained from public sources which PSPL has no reason to believe are unreliable and any analysis, forecasts, projections, expectations and opinions (collectively the “Research”) contained in these commentaries are based on such information and are expressions of belief only. PSPL has not verified this information and no representation or warranty, express or implied, is made that such information or Research is accurate, complete or verified or should be relied upon as such. Any such information or Research contained in these commentaries are subject to change, and PSPL shall not have any responsibility to maintain the information or Research made available or to supply any corrections, updates or releases in connection therewith. In no event will PSPL be liable for any special, indirect, incidental or consequential damages which may be incurred from the use of the information or Research made available, even if it has been advised of the possibility of such damages. The companies and their employees mentioned in these commentaries cannot be held liable for any errors, inaccuracies and/or omissions howsoever caused. Any opinion or advice herein is made on a general basis and is subject to change without notice. The information provided in these commentaries may contain optimistic statements regarding future events or future financial performance of countries, markets or companies. You must make your own financial assessment of the relevance, accuracy and adequacy of the information provided in these commentaries. Views and any strategies described in these commentaries may not be suitable for all investors. Opinions expressed herein may differ from the opinions expressed by other units of PSPL or its connected persons and associates. Any reference to or discussion of investment products or commodities in these commentaries is purely for illustrative purposes only and must not be construed as a recommendation, an offer or solicitation for the subscription, purchase or sale of the investment products or commodities mentioned. This advertisement has not been reviewed by the Monetary Authority of Singapore.
ETF Monthly Outlook: Sideways Consolidation Expected Across Most Asset Classes in July 2026
Market Overview and Performance Summary The ETF market landscape presents a mixed picture heading into July 2026, with most major asset classes expected to enter periods of sideways consolidation following varied performance in June. According to the latest monthly analysis, investors should prepare for range-bound trading across several key exchange-traded funds tracking major indices and commodities. Asset Class Performance Analysis Equities showed divergent trends during June, with the Vanguard S&P 500 ETF (VOO) ending two consecutive months of gains with a 0.9% decline. The fund is expected to extend its sideways consolidation from June into July as markets digest recent moves. In contrast, Singapore equities demonstrated strength, with the SPDR Singapore Equities ETF (ES3) posting its third consecutive monthly gain of 3% in June, though analysts expect consolidation after the ETF reached target levels. Fixed income markets remained relatively stable, with the iShares 7-10 Year Treasury Bond ETF (IEF) trading flat during June. The bond ETF is anticipated to remain range-bound between US$93.40 and US$95.40 in July, extending a sideways consolidation pattern that has persisted since mid-March. Commodities faced significant headwinds, particularly in the precious metals sector. The SPDR Gold MiniShares Trust (GLDM) recorded its fourth consecutive monthly decline, tumbling 11.6% in June. Despite this weakness, analysts expect sideways consolidation in July, with support likely to hold at US$77.50 should the price retest the swing low from October 2025. Energy sector weakness continued, with the SPDR S&P Oil & Gas Exploration & Production ETF (XOP) falling 5.4% in June, marking its third consecutive monthly decline. The ETF is expected to consolidate sideways in July, with support anticipated in the US$148 to US$154 area. Notable Underperformers The cryptocurrency space showed particular vulnerability, with the ProShares Bitcoin Strategy ETF (BITO) tumbling 20.2% in June, marking its second consecutive monthly decline. Unlike other asset classes, Bitcoin ETFs are expected to continue their bearish trend in July, potentially retesting the US$7.44 swing low from August 2024, representing a 6.7% downside from current levels. Asian markets also faced pressure, with the Hang Seng China Enterprises Index ETF (2828) declining 9.6% in June for its second consecutive monthly drop. However, sideways consolidation is expected, with support between HKD$74.65 and HKD$77.10. Frequently Asked Questions [market_journal_faq] This article has been auto-generated using PhillipGPT. It is based on a report by a Phillip Securities Research analyst. Disclaimer These commentaries are intended for general circulation and do not have regard to the specific investment objectives, financial situation and particular needs of any person. Accordingly, no warranty whatsoever is given and no liability whatsoever is accepted for any loss arising whether directly or indirectly as a result of any person acting based on this information. You should seek advice from a financial adviser regarding the suitability of any investment product(s) mentioned herein, taking into account your specific investment objectives, financial situation or particular needs, before making a commitment to invest in such products. Opinions expressed in these commentaries are subject to change without notice. Investments are subject to investment risks including the possible loss of the principal amount invested. The value of units in any fund and the income from them may fall as well as rise. Past performance figures as well as any projection or forecast used in these commentaries are not necessarily indicative of future or likely performance. Phillip Securities Pte Ltd (PSPL), its directors, connected persons or employees may from time to time have an interest in the financial instruments mentioned in these commentaries. The information contained in these commentaries has been obtained from public sources which PSPL has no reason to believe are unreliable and any analysis, forecasts, projections, expectations and opinions (collectively the “Research”) contained in these commentaries are based on such information and are expressions of belief only. PSPL has not verified this information and no representation or warranty, express or implied, is made that such information or Research is accurate, complete or verified or should be relied upon as such. Any such information or Research contained in these commentaries are subject to change, and PSPL shall not have any responsibility to maintain the information or Research made available or to supply any corrections, updates or releases in connection therewith. In no event will PSPL be liable for any special, indirect, incidental or consequential damages which may be incurred from the use of the information or Research made available, even if it has been advised of the possibility of such damages. The companies and their employees mentioned in these commentaries cannot be held liable for any errors, inaccuracies and/or omissions howsoever caused. Any opinion or advice herein is made on a general basis and is subject to change without notice. The information provided in these commentaries may contain optimistic statements regarding future events or future financial performance of countries, markets or companies. You must make your own financial assessment of the relevance, accuracy and adequacy of the information provided in these commentaries. Views and any strategies described in these commentaries may not be suitable for all investors. Opinions expressed herein may differ from the opinions expressed by other units of PSPL or its connected persons and associates. Any reference to or discussion of investment products or commodities in these commentaries is purely for illustrative purposes only and must not be construed as a recommendation, an offer or solicitation for the subscription, purchase or sale of the investment products or commodities mentioned. This advertisement has not been reviewed by the Monetary Authority of Singapore.


